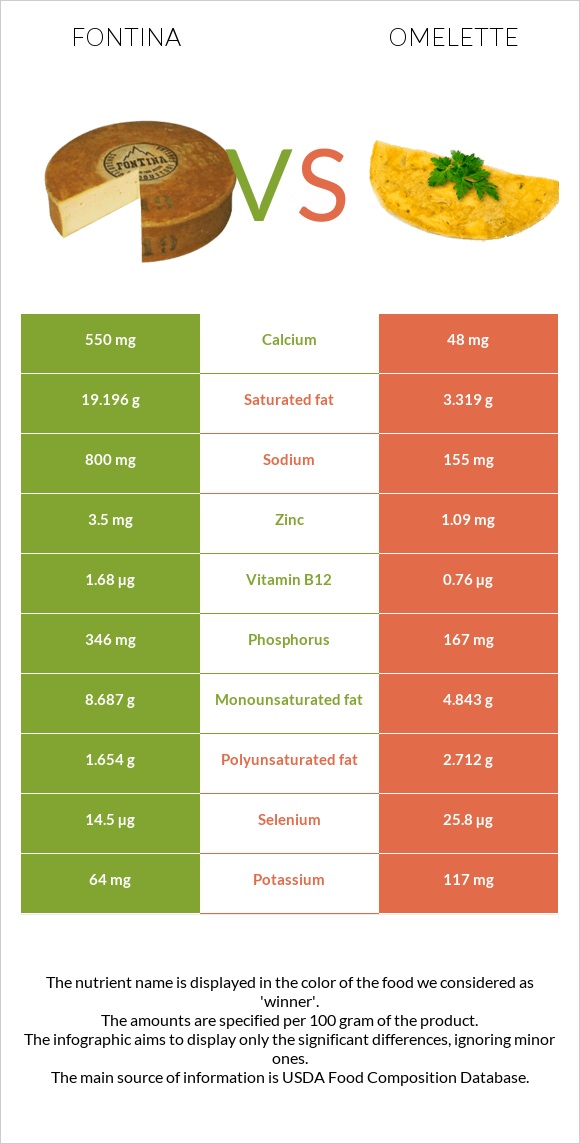
Significant differences between fontina and omelette Fontina is richer in calcium, vitamin B12, phosphorus, and zinc, while omelette is higher in choline, selenium, and vitamin B5. Fontina covers your daily saturated fat needs 79% more than omelette. Fontina has 11 times more calcium than omelette. Fontina has 550mg of calcium, while omelette has 48mg. Omelette is lower in saturated fat. Fontina has a higher glycemic index (27) than omelette (0). Specific food types used in this comparison are Cheese, fontina and Egg, whole, cooked, omelet .
Infographic
Mineral Comparison
Mineral comparison score is based on the number of minerals by which one or the other food is richer. The "coverage" charts below show how much of the daily needs can be covered by 300 grams of the food.
4
100 g
300 g
1 cubic inch - 15g 1 slice (1 oz) - 28g 1 oz - 28.35g 1 cup, shredded - 108g 1 cup, diced - 132g 1 package (8 oz) - 227g
Magnesium
Magnesium
Calcium
Calcium
Potassium
Potassium
Iron
Iron
Copper
Copper
Zinc
Zinc
Phosphorus
Phosphorus
Sodium
Sodium
Manganese
Manganese
Selenium
Selenium
10%
165%
5.6%
8.6%
8.3%
95%
148%
104%
1.8%
79%
6
100 g
300 g
1 tbsp - 15g 1 large - 61g
Magnesium
Magnesium
Calcium
Calcium
Potassium
Potassium
Iron
Iron
Copper
Copper
Zinc
Zinc
Phosphorus
Phosphorus
Sodium
Sodium
Manganese
Manganese
Selenium
Selenium
7.9%
14%
10%
56%
21%
30%
72%
20%
3.1%
141%
Vitamin Comparison
Vitamin comparison score is based on the number of vitamins by which one or the other food is richer. The "coverage" charts below show how much of the daily needs can be covered by 300 grams of the food.
3
100 g
300 g
1 cubic inch - 15g 1 slice (1 oz) - 28g 1 oz - 28.35g 1 cup, shredded - 108g 1 cup, diced - 132g 1 package (8 oz) - 227g
Vitamin C
Vit. C
Vitamin D
Vit. D
Vitamin A
Vit. A
Vitamin E
Vit. E
Vitamin B1
Vit. B1
Vitamin B2
Vit. B2
Vitamin B3
Vit. B3
Vitamin B5
Vit. B5
Vitamin B6
Vit. B6
Vitamin B12
Vit. B12
Vitamin K
Vit. K
Folate
Folate
0%
9%
87%
5.4%
5.3%
47%
2.8%
26%
19%
210%
6.5%
4.5%
8
100 g
300 g
1 tbsp - 15g 1 large - 61g
Vitamin C
Vit. C
Vitamin D
Vit. D
Vitamin A
Vit. A
Vitamin E
Vit. E
Vitamin B1
Vit. B1
Vitamin B2
Vit. B2
Vitamin B3
Vit. B3
Vitamin B5
Vit. B5
Vitamin B6
Vit. B6
Vitamin B12
Vit. B12
Vitamin K
Vit. K
Folate
Folate
0%
26%
57%
26%
8.5%
89%
1.2%
77%
33%
95%
11%
29%
All nutrients comparison - raw data values
Nutrient
DV% diff.
Saturated fat
19.196g
3.319g
72%
Cholesterol
116mg
313mg
66%
Calcium
550mg
48mg
50%
Choline
15.4mg
247.6mg
42%
Vitamin B12
1.68µg
0.76µg
38%
Protein
25.6g
10.57g
30%
Fats
31.14g
11.66g
30%
Sodium
800mg
155mg
28%
Phosphorus
346mg
167mg
26%
Zinc
3.5mg
1.09mg
22%
Selenium
14.5µg
25.8µg
21%
Vitamin B5
0.429mg
1.289mg
17%
Iron
0.23mg
1.48mg
16%
Vitamin B2
0.204mg
0.386mg
14%
Calories
389kcal
154kcal
12%
Vitamin A
261µg
172µg
10%
Monounsaturated fat
8.687g
4.843g
10%
Folate
6µg
39µg
8%
Vitamin E
0.27mg
1.29mg
7%
Polyunsaturated fat
1.654g
2.712g
7%
Vitamin D*
23 IU
69 IU
6%
Vitamin D
0.6µg
1.7µg
6%
Vitamin B6
0.083mg
0.143mg
5%
Copper
0.025mg
0.063mg
4%
Potassium
64mg
117mg
2%
Vitamin K
2.6µg
4.5µg
2%
Magnesium
14mg
11mg
1%
Vitamin B1
0.021mg
0.034mg
1%
Vitamin B3
0.15mg
0.064mg
1%
Protein per 100 calories
6.6g
6.9g
N/A
Calories per 10 g protein
152kcal
146kcal
N/A
Weight per 100 calories
26g
65g
N/A
Unsaturated / Saturated Fat ratio
0.54
2.3
N/A
Net carbs
1.55g
0.64g
N/A
Carbs
1.55g
0.64g
0%
Sugar
1.55g
0.31g
N/A
Manganese
0.014mg
0.024mg
0%
Trans fat
0.709g
N/A
Tryptophan
0.361mg
0.14mg
0%
Threonine
0.935mg
0.467mg
0%
Isoleucine
1.384mg
0.565mg
0%
Leucine
2.664mg
0.913mg
0%
Lysine
2.328mg
0.767mg
0%
Methionine
0.706mg
0.319mg
0%
Phenylalanine
1.497mg
0.572mg
0%
Valine
1.926mg
0.722mg
0%
Histidine
0.959mg
0.26mg
0%
Omega-3 - DHA
0g
0.049g
N/A
Omega-3 - DPA
0g
0.006g
N/A
Omega-6 - Eicosadienoic acid
0.015g
N/A
Macronutrient Comparison
Macronutrient breakdown side-by-side comparison
4
26%
31%
38%
4%
Protein:
25.6 g
Fats:
31.14 g
Carbs:
1.55 g
Water:
37.92 g
Other:
3.79 g
1
11%
12%
76%
Protein:
10.57 g
Fats:
11.66 g
Carbs:
0.64 g
Water:
76.13 g
Other:
1 g
Contains
more
Protein Protein
+142.2%
Contains
more
Fats Fats
+167.1%
Contains
more
Carbs Carbs
+142.2%
Contains
more
Other Other
+279%
Contains
more
Water Water
+100.8%
Fat Type Comparison
Fat type breakdown side-by-side comparison
1
65%
29%
6%
Saturated fat:
Sat. Fat
19.196 g
Monounsaturated fat:
Mono. Fat
8.687 g
Polyunsaturated fat:
Poly. Fat
1.654 g
2
31%
45%
25%
Saturated fat:
Sat. Fat
3.319 g
Monounsaturated fat:
Mono. Fat
4.843 g
Polyunsaturated fat:
Poly. Fat
2.712 g
Contains
more
Mono. Fat Monounsaturated fat
+79.4%
Contains
less
Sat. Fat Saturated fat
-82.7%
Contains
more
Poly. Fat Polyunsaturated fat
+64%