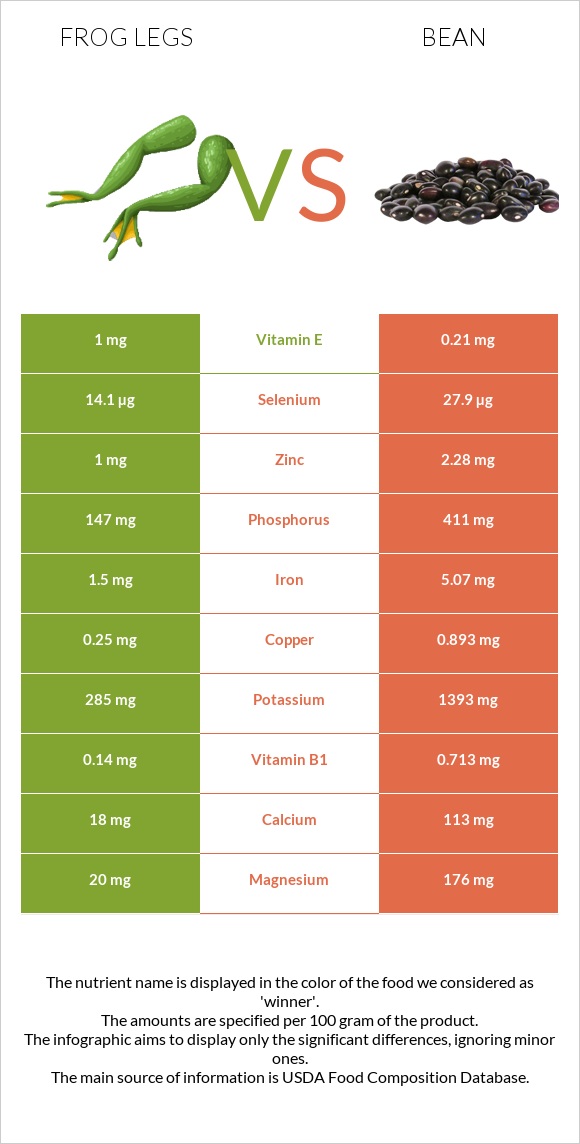
How are frog legs and beans different? Frog legs are higher in selenium, vitamin B12, iron, vitamin B2, choline, phosphorus, and vitamin E; however, beans are richer in fiber. Daily need coverage for fiber for beans is 22% higher. Frog legs have a lower glycemic index (0) than beans (33). Frog legs, raw and Beans, baked, canned, no salt added are the varieties used in this article.
Infographic
Mineral Comparison
Mineral comparison score is based on the number of minerals by which one or the other food is richer. The "coverage" charts below show how much of the daily needs can be covered by 300 grams of the food.
4
100 g
300 g
1 leg - 45g
Magnesium
Magnesium
Calcium
Calcium
Potassium
Potassium
Iron
Iron
Copper
Copper
Zinc
Zinc
Phosphorus
Phosphorus
Sodium
Sodium
Manganese
Manganese
Selenium
Selenium
14%
5.4%
25%
56%
83%
27%
63%
7.6%
0%
77%
4
100 g
300 g
1 cup - 253g
Magnesium
Magnesium
Calcium
Calcium
Potassium
Potassium
Iron
Iron
Copper
Copper
Zinc
Zinc
Phosphorus
Phosphorus
Sodium
Sodium
Manganese
Manganese
Selenium
Selenium
23%
15%
26%
11%
69%
38%
45%
0.13%
0%
25%
Vitamin Comparison
Vitamin comparison score is based on the number of vitamins by which one or the other food is richer. The "coverage" charts below show how much of the daily needs can be covered by 300 grams of the food.
6
100 g
300 g
1 leg - 45g
Vitamin C
Vit. C
Vitamin D
Vit. D
Vitamin A
Vit. A
Vitamin E
Vit. E
Vitamin B1
Vit. B1
Vitamin B2
Vit. B2
Vitamin B3
Vit. B3
Vitamin B5
Vit. B5
Vitamin B6
Vit. B6
Vitamin B12
Vit. B12
Vitamin K
Vit. K
Folate
Folate
0%
3%
5%
20%
35%
58%
23%
0%
28%
50%
0.25%
11%
3
100 g
300 g
1 cup - 253g
Vitamin C
Vit. C
Vitamin D
Vit. D
Vitamin A
Vit. A
Vitamin E
Vit. E
Vitamin B1
Vit. B1
Vitamin B2
Vit. B2
Vitamin B3
Vit. B3
Vitamin B5
Vit. B5
Vitamin B6
Vit. B6
Vitamin B12
Vit. B12
Vitamin K
Vit. K
Folate
Folate
10%
0%
1.7%
3%
38%
14%
8.1%
0%
30%
0%
2%
18%
All nutrients comparison - raw data values
Nutrient
DV% diff.
Protein
16.4g
4.8g
23%
Fiber
0g
5.5g
22%
Cholesterol
50mg
0mg
17%
Selenium
14.1µg
4.5µg
17%
Vitamin B12
0.4µg
0µg
17%
Iron
1.5mg
0.29mg
15%
Vitamin B2
0.25mg
0.06mg
15%
Carbs
0g
20.49g
7%
Phosphorus
147mg
104mg
6%
Vitamin E
1mg
0.15mg
6%
Choline
65mg
30.8mg
6%
Copper
0.25mg
0.206mg
5%
Vitamin B3
1.2mg
0.43mg
5%
Zinc
1mg
1.4mg
4%
Vitamin C
0mg
3.1mg
3%
Magnesium
20mg
32mg
3%
Calcium
18mg
50mg
3%
Calories
73kcal
105kcal
2%
Sodium
58mg
1mg
2%
Folate
15µg
24µg
2%
Vitamin D*
8 IU
0 IU
1%
Vitamin D
0.2µg
0µg
1%
Vitamin A
15µg
5µg
1%
Vitamin B1
0.14mg
0.15mg
1%
Vitamin B6
0.12mg
0.13mg
1%
Vitamin K
0.1µg
0.8µg
1%
Protein per 100 calories
22g
4.6g
N/A
Calories per 10 g protein
45kcal
219kcal
N/A
Weight per 100 calories
137g
95g
N/A
Fats
0.3g
0.4g
0%
Net carbs
0g
14.99g
N/A
Potassium
285mg
296mg
0%
Sugar
0g
7.78g
N/A
Saturated fat
0.076g
0.103g
0%
Monounsaturated fat
0.053g
0.035g
0%
Polyunsaturated fat
0.102g
0.172g
0%
Omega-3 - EPA
0.014g
0g
N/A
Omega-3 - DHA
0.02g
0g
N/A
Omega-3 - DPA
0.007g
0g
N/A
Macronutrient Comparison
Macronutrient breakdown side-by-side comparison
2
16%
82%
Protein:
16.4 g
Fats:
0.3 g
Carbs:
0 g
Water:
81.9 g
Other:
1.4 g
3
5%
20%
73%
2%
Protein:
4.8 g
Fats:
0.4 g
Carbs:
20.49 g
Water:
72.6 g
Other:
1.71 g
Contains
more
Protein Protein
+241.7%
Contains
more
Water Water
+12.8%
Contains
more
Fats Fats
+33.3%
Contains
more
Carbs Carbs
+∞%
Contains
more
Other Other
+22.1%
Fat Type Comparison
Fat type breakdown side-by-side comparison
2
33%
23%
44%
Saturated fat:
Sat. Fat
0.076 g
Monounsaturated fat:
Mono. Fat
0.053 g
Polyunsaturated fat:
Poly. Fat
0.102 g
1
33%
11%
55%
Saturated fat:
Sat. Fat
0.103 g
Monounsaturated fat:
Mono. Fat
0.035 g
Polyunsaturated fat:
Poly. Fat
0.172 g
Contains
less
Sat. Fat Saturated fat
-26.2%
Contains
more
Mono. Fat Monounsaturated fat
+51.4%
Contains
more
Poly. Fat Polyunsaturated fat
+68.6%