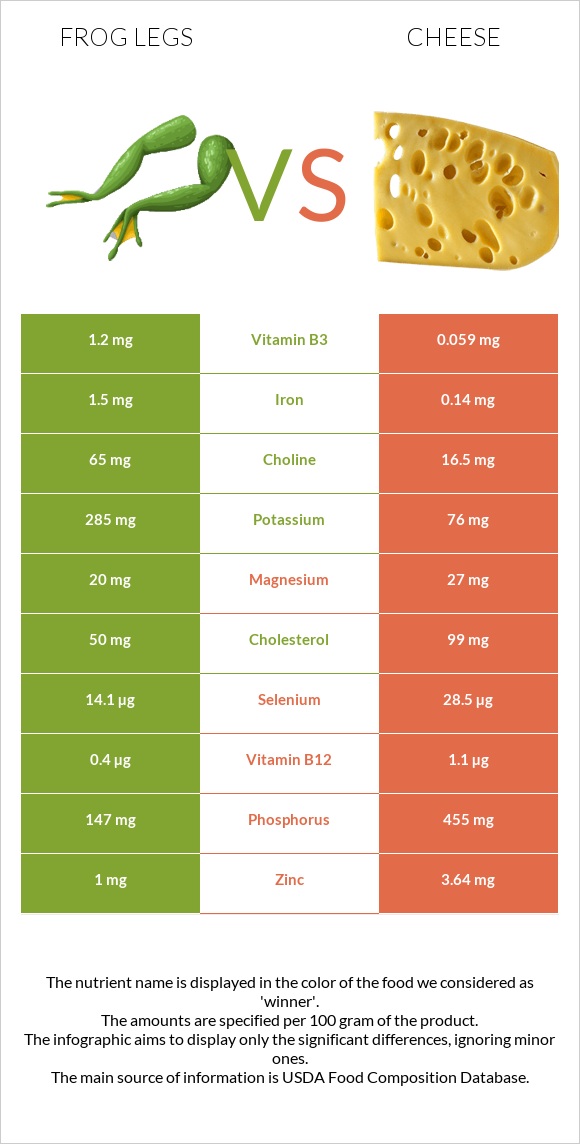
How are frog legs and cheese different? Frog legs are higher in copper and iron; however, cheese is richer in calcium, phosphorus, vitamin B12, selenium, zinc, and vitamin A. Daily need coverage for saturated fat for cheese is 94% higher. Frog legs contain 11 times more iron than cheese. While frog legs contain 1.5mg of iron, cheese contains only 0.14mg. Frog legs have less sodium. Frog legs, raw and Cheese, cheddar are the varieties used in this article.
Infographic
Mineral Comparison
Mineral comparison score is based on the number of minerals by which one or the other food is richer. The "coverage" charts below show how much of the daily needs can be covered by 300 grams of the food.
4
100 g
300 g
1 leg - 45g
Magnesium
Magnesium
Calcium
Calcium
Potassium
Potassium
Iron
Iron
Copper
Copper
Zinc
Zinc
Phosphorus
Phosphorus
Sodium
Sodium
Manganese
Manganese
Selenium
Selenium
14%
5.4%
25%
56%
83%
27%
63%
7.6%
0%
77%
6
100 g
300 g
1 cubic inch - 17g 1 slice (1 oz) - 28g 1 oz - 28.35g 1 cup, shredded - 113g 1 cup, diced - 132g 1 cup, melted - 244g
Magnesium
Magnesium
Calcium
Calcium
Potassium
Potassium
Iron
Iron
Copper
Copper
Zinc
Zinc
Phosphorus
Phosphorus
Sodium
Sodium
Manganese
Manganese
Selenium
Selenium
19%
213%
6.7%
5.3%
10%
99%
195%
85%
3.5%
155%
Vitamin Comparison
Vitamin comparison score is based on the number of vitamins by which one or the other food is richer. The "coverage" charts below show how much of the daily needs can be covered by 300 grams of the food.
4
100 g
300 g
1 leg - 45g
Vitamin C
Vit. C
Vitamin D
Vit. D
Vitamin A
Vit. A
Vitamin E
Vit. E
Vitamin B1
Vit. B1
Vitamin B2
Vit. B2
Vitamin B3
Vit. B3
Vitamin B5
Vit. B5
Vitamin B6
Vit. B6
Vitamin B12
Vit. B12
Vitamin K
Vit. K
Folate
Folate
0%
3%
5%
20%
35%
58%
23%
0%
28%
50%
0.25%
11%
7
100 g
300 g
1 cubic inch - 17g 1 slice (1 oz) - 28g 1 oz - 28.35g 1 cup, shredded - 113g 1 cup, diced - 132g 1 cup, melted - 244g
Vitamin C
Vit. C
Vitamin D
Vit. D
Vitamin A
Vit. A
Vitamin E
Vit. E
Vitamin B1
Vit. B1
Vitamin B2
Vit. B2
Vitamin B3
Vit. B3
Vitamin B5
Vit. B5
Vitamin B6
Vit. B6
Vitamin B12
Vit. B12
Vitamin K
Vit. K
Folate
Folate
0%
9%
110%
14%
7.3%
99%
1.1%
25%
15%
138%
6%
20%
All nutrients comparison - raw data values
Nutrient
DV% diff.
Saturated fat
0.076g
18.867g
85%
Calcium
18mg
710mg
69%
Fats
0.3g
33.31g
51%
Phosphorus
147mg
455mg
44%
Vitamin A
15µg
330µg
35%
Vitamin B12
0.4µg
1.1µg
29%
Sodium
58mg
653mg
26%
Selenium
14.1µg
28.5µg
26%
Copper
0.25mg
0.03mg
24%
Zinc
1mg
3.64mg
24%
Monounsaturated fat
0.053g
9.246g
23%
Calories
73kcal
404kcal
17%
Iron
1.5mg
0.14mg
17%
Cholesterol
50mg
99mg
16%
Vitamin B2
0.25mg
0.428mg
14%
Protein
16.4g
22.87g
13%
Vitamin B1
0.14mg
0.029mg
9%
Choline
65mg
16.5mg
9%
Polyunsaturated fat
0.102g
1.421g
9%
Vitamin B5
0.41mg
8%
Vitamin B3
1.2mg
0.059mg
7%
Potassium
285mg
76mg
6%
Vitamin B6
0.12mg
0.066mg
4%
Folate
15µg
27µg
3%
Vitamin D*
8 IU
24 IU
2%
Vitamin D
0.2µg
0.6µg
2%
Magnesium
20mg
27mg
2%
Vitamin E
1mg
0.71mg
2%
Vitamin K
0.1µg
2.4µg
2%
Carbs
0g
3.09g
1%
Manganese
0.027mg
1%
Protein per 100 calories
22g
5.7g
N/A
Calories per 10 g protein
45kcal
177kcal
N/A
Weight per 100 calories
137g
25g
N/A
Unsaturated / Saturated Fat ratio
2
0.57
N/A
Net carbs
0g
3.09g
N/A
Sugar
0g
0.48g
N/A
Trans fat
0.917g
N/A
Tryptophan
0.547mg
0%
Threonine
1.044mg
0%
Isoleucine
1.206mg
0%
Leucine
1.939mg
0%
Lysine
1.025mg
0%
Methionine
0.547mg
0%
Phenylalanine
1.074mg
0%
Valine
1.404mg
0%
Histidine
0.547mg
0%
Omega-3 - EPA
0.014g
0.01g
N/A
Omega-3 - DHA
0.02g
0.001g
N/A
Omega-3 - DPA
0.007g
0.017g
N/A
Omega-6 - Eicosadienoic acid
0.007g
N/A
Macronutrient Comparison
Macronutrient breakdown side-by-side comparison
1
16%
82%
Protein:
16.4 g
Fats:
0.3 g
Carbs:
0 g
Water:
81.9 g
Other:
1.4 g
4
23%
33%
3%
37%
4%
Protein:
22.87 g
Fats:
33.31 g
Carbs:
3.09 g
Water:
37.02 g
Other:
3.71 g
Contains
more
Water Water
+121.2%
Contains
more
Protein Protein
+39.5%
Contains
more
Fats Fats
+11003.3%
Contains
more
Carbs Carbs
+∞%
Contains
more
Other Other
+165%
Fat Type Comparison
Fat type breakdown side-by-side comparison
1
33%
23%
44%
Saturated fat:
Sat. Fat
0.076 g
Monounsaturated fat:
Mono. Fat
0.053 g
Polyunsaturated fat:
Poly. Fat
0.102 g
2
64%
31%
5%
Saturated fat:
Sat. Fat
18.867 g
Monounsaturated fat:
Mono. Fat
9.246 g
Polyunsaturated fat:
Poly. Fat
1.421 g
Contains
less
Sat. Fat Saturated fat
-99.6%
Contains
more
Mono. Fat Monounsaturated fat
+17345.3%
Contains
more
Poly. Fat Polyunsaturated fat
+1293.1%