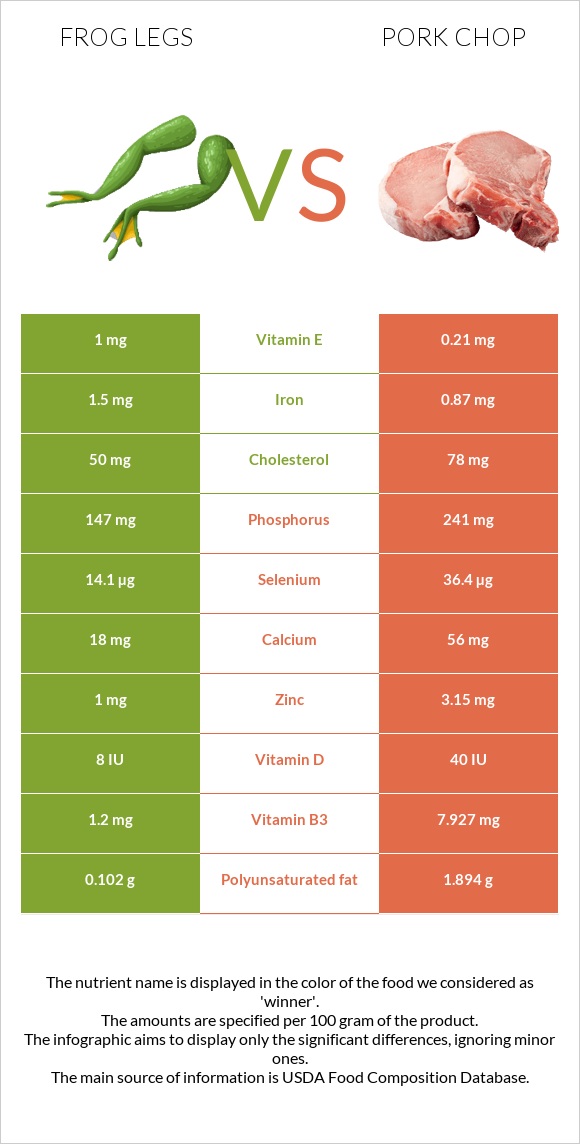
Significant differences between frog legs and pork chop Frog legs are richer in copper, while pork chop is higher in vitamin B3, selenium, vitamin B1, vitamin B6, zinc, phosphorus, and vitamin B12. Pork chop covers your daily vitamin B3 needs 42% more than frog legs. Frog legs have 2 times more copper than pork chop. Frog legs have 0.25mg of copper, while pork chop has 0.105mg. Frog legs are lower in cholesterol. Specific food types used in this comparison are Frog legs, raw and Pork, fresh, loin, blade (chops), bone-in, separable lean, and fat, cooked, broiled .
Infographic
Mineral Comparison
Mineral comparison score is based on the number of minerals by which one or the other food is richer. The "coverage" charts below show how much of the daily needs can be covered by 300 grams of the food.
3
100 g
300 g
1 leg - 45g
Magnesium
Magnesium
Calcium
Calcium
Potassium
Potassium
Iron
Iron
Copper
Copper
Zinc
Zinc
Phosphorus
Phosphorus
Sodium
Sodium
Manganese
Manganese
Selenium
Selenium
14%
5.4%
25%
56%
83%
27%
63%
7.6%
0%
77%
6
100 g
300 g
3 oz - 85g 1 chop - 219g
Magnesium
Magnesium
Calcium
Calcium
Potassium
Potassium
Iron
Iron
Copper
Copper
Zinc
Zinc
Phosphorus
Phosphorus
Sodium
Sodium
Manganese
Manganese
Selenium
Selenium
14%
17%
28%
33%
35%
86%
103%
9.7%
1.3%
199%
Vitamin Comparison
Vitamin comparison score is based on the number of vitamins by which one or the other food is richer. The "coverage" charts below show how much of the daily needs can be covered by 300 grams of the food.
4
100 g
300 g
1 leg - 45g
Vitamin C
Vit. C
Vitamin D
Vit. D
Vitamin A
Vit. A
Vitamin E
Vit. E
Vitamin B1
Vit. B1
Vitamin B2
Vit. B2
Vitamin B3
Vit. B3
Vitamin B5
Vit. B5
Vitamin B6
Vit. B6
Vitamin B12
Vit. B12
Vitamin K
Vit. K
Folate
Folate
0%
3%
5%
20%
35%
58%
23%
0%
28%
50%
0.25%
11%
7
100 g
300 g
3 oz - 85g 1 chop - 219g
Vitamin C
Vit. C
Vitamin D
Vit. D
Vitamin A
Vit. A
Vitamin E
Vit. E
Vitamin B1
Vit. B1
Vitamin B2
Vit. B2
Vitamin B3
Vit. B3
Vitamin B5
Vit. B5
Vitamin B6
Vit. B6
Vitamin B12
Vit. B12
Vitamin K
Vit. K
Folate
Folate
0%
15%
1.3%
4.2%
123%
72%
149%
66%
113%
83%
0%
0%
All nutrients comparison - raw data values
Nutrient
DV% diff.
Vitamin B3
1.2mg
7.927mg
42%
Selenium
14.1µg
36.4µg
41%
Vitamin B1
0.14mg
0.49mg
29%
Vitamin B6
0.12mg
0.489mg
28%
Fats
0.3g
14.35g
22%
Vitamin B5
1.104mg
22%
Zinc
1mg
3.15mg
20%
Saturated fat
0.076g
4.339g
19%
Copper
0.25mg
0.105mg
16%
Protein
16.4g
23.72g
15%
Phosphorus
147mg
241mg
13%
Monounsaturated fat
0.053g
4.887g
12%
Polyunsaturated fat
0.102g
1.894g
12%
Vitamin B12
0.4µg
0.66µg
11%
Cholesterol
50mg
78mg
9%
Calories
73kcal
231kcal
8%
Iron
1.5mg
0.87mg
8%
Vitamin E
1mg
0.21mg
5%
Vitamin B2
0.25mg
0.313mg
5%
Vitamin D*
8 IU
40 IU
4%
Vitamin D
0.2µg
1µg
4%
Calcium
18mg
56mg
4%
Folate
15µg
0µg
4%
Potassium
285mg
315mg
1%
Sodium
58mg
74mg
1%
Vitamin A
15µg
4µg
1%
Protein per 100 calories
22g
10g
N/A
Calories per 10 g protein
45kcal
97kcal
N/A
Weight per 100 calories
137g
43g
N/A
Unsaturated / Saturated Fat ratio
2
1.6
N/A
Magnesium
20mg
20mg
0%
Manganese
0.01mg
0%
Vitamin K
0.1µg
0µg
0%
Trans fat
0.066g
N/A
Choline
65mg
67.5mg
0%
Tryptophan
0.282mg
0%
Threonine
1.043mg
0%
Isoleucine
1.123mg
0%
Leucine
1.952mg
0%
Lysine
2.109mg
0%
Methionine
0.65mg
0%
Phenylalanine
0.985mg
0%
Valine
1.2mg
0%
Histidine
0.965mg
0%
Omega-3 - EPA
0.014g
0g
N/A
Omega-3 - DHA
0.02g
0.001g
N/A
Omega-3 - ALA
0.065g
N/A
Omega-3 - DPA
0.007g
0.011g
N/A
Omega-6 - Gamma-linoleic acid
0.003g
N/A
Omega-6 - Eicosadienoic acid
0.065g
N/A
Omega-6 - Linoleic acid
0.922g
N/A
Macronutrient Comparison
Macronutrient breakdown side-by-side comparison
2
16%
82%
Protein:
16.4 g
Fats:
0.3 g
Carbs:
0 g
Water:
81.9 g
Other:
1.4 g
2
24%
14%
61%
Protein:
23.72 g
Fats:
14.35 g
Carbs:
0 g
Water:
61.45 g
Other:
0.48 g
Contains
more
Water Water
+33.3%
Contains
more
Other Other
+191.7%
Contains
more
Protein Protein
+44.6%
Contains
more
Fats Fats
+4683.3%
Fat Type Comparison
Fat type breakdown side-by-side comparison
1
33%
23%
44%
Saturated fat:
Sat. Fat
0.076 g
Monounsaturated fat:
Mono. Fat
0.053 g
Polyunsaturated fat:
Poly. Fat
0.102 g
2
39%
44%
17%
Saturated fat:
Sat. Fat
4.339 g
Monounsaturated fat:
Mono. Fat
4.887 g
Polyunsaturated fat:
Poly. Fat
1.894 g
Contains
less
Sat. Fat Saturated fat
-98.2%
Contains
more
Mono. Fat Monounsaturated fat
+9120.8%
Contains
more
Poly. Fat Polyunsaturated fat
+1756.9%