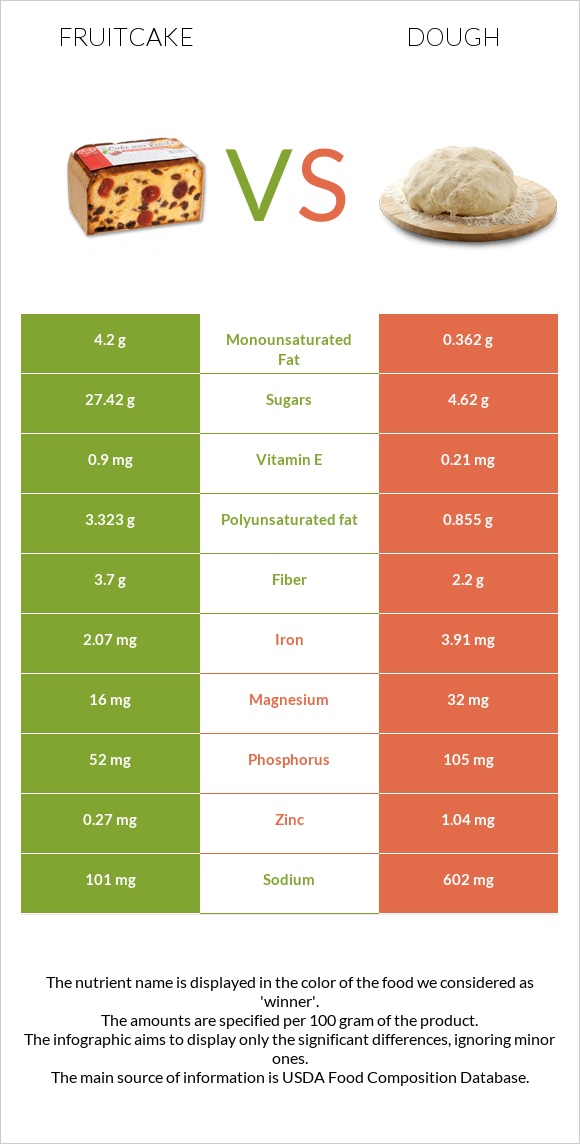
How are fruitcake and dough different? Dough has more vitamin B1, selenium, folate, vitamin B2, vitamin B3, iron, manganese, copper, and phosphorus than fruitcake. Daily need coverage for vitamin B1 for dough is 55% higher. Fruitcake has less sodium. Fruitcake has a lower glycemic index (53) than dough (70). Cake, fruitcake, commercially prepared and Bread, french or vienna (includes sourdough) are the varieties used in this article.
Infographic
Mineral Comparison
Mineral comparison score is based on the number of minerals by which one or the other food is richer. The "coverage" charts below show how much of the daily needs can be covered by 300 grams of the food.
2
100 g
300 g
1 oz - 28.35g 1 piece - 43g
Magnesium
Magnesium
Calcium
Calcium
Potassium
Potassium
Iron
Iron
Copper
Copper
Zinc
Zinc
Phosphorus
Phosphorus
Sodium
Sodium
Manganese
Manganese
Selenium
Selenium
11%
9.9%
14%
78%
17%
7.4%
22%
13%
29%
11%
8
100 g
300 g
1 oz - 28.35g 1 slice - 139g
Magnesium
Magnesium
Calcium
Calcium
Potassium
Potassium
Iron
Iron
Copper
Copper
Zinc
Zinc
Phosphorus
Phosphorus
Sodium
Sodium
Manganese
Manganese
Selenium
Selenium
23%
16%
10%
147%
51%
28%
45%
79%
75%
156%
Vitamin Comparison
Vitamin comparison score is based on the number of vitamins by which one or the other food is richer. The "coverage" charts below show how much of the daily needs can be covered by 300 grams of the food.
5
100 g
300 g
1 oz - 28.35g 1 piece - 43g
Vitamin C
Vit. C
Vitamin D
Vit. D
Vitamin A
Vit. A
Vitamin E
Vit. E
Vitamin B1
Vit. B1
Vitamin B2
Vit. B2
Vitamin B3
Vit. B3
Vitamin B5
Vit. B5
Vitamin B6
Vit. B6
Vitamin B12
Vit. B12
Vitamin K
Vit. K
Folate
Folate
1.7%
0%
2.3%
18%
13%
23%
15%
14%
11%
1.3%
3.8%
15%
6
100 g
300 g
1 oz - 28.35g 1 slice - 139g
Vitamin C
Vit. C
Vitamin D
Vit. D
Vitamin A
Vit. A
Vitamin E
Vit. E
Vitamin B1
Vit. B1
Vitamin B2
Vit. B2
Vitamin B3
Vit. B3
Vitamin B5
Vit. B5
Vitamin B6
Vit. B6
Vitamin B12
Vit. B12
Vitamin K
Vit. K
Folate
Folate
0%
0%
0%
4.2%
178%
99%
90%
27%
25%
0%
1.8%
92%
All nutrients comparison - raw data values
Nutrient
DV% diff.
Vitamin B1
0.05mg
0.71mg
55%
Selenium
2µg
28.6µg
48%
Folate
20µg
123µg
26%
Vitamin B2
0.099mg
0.427mg
25%
Vitamin B3
0.791mg
4.817mg
25%
Iron
2.07mg
3.91mg
23%
Sodium
101mg
602mg
22%
Starch
44.23g
18%
Protein
2.9g
10.75g
16%
Manganese
0.22mg
0.577mg
16%
Polyunsaturated fat
3.323g
0.855g
16%
Copper
0.05mg
0.152mg
11%
Fats
9.1g
2.42g
10%
Monounsaturated fat
4.2g
0.362g
10%
Phosphorus
52mg
105mg
8%
Zinc
0.27mg
1.04mg
7%
Fiber
3.7g
2.2g
6%
Vitamin E
0.9mg
0.21mg
5%
Vitamin B5
0.226mg
0.455mg
5%
Vitamin B6
0.046mg
0.107mg
5%
Magnesium
16mg
32mg
4%
Calories
324kcal
272kcal
3%
Carbs
61.6g
51.88g
3%
Cholesterol
5mg
0mg
2%
Calcium
33mg
52mg
2%
Saturated fat
1.048g
0.529g
2%
Vitamin C
0.5mg
0mg
1%
Potassium
153mg
117mg
1%
Vitamin A
7µg
0µg
1%
Vitamin K
1.5µg
0.7µg
1%
Fructose
0.51g
1%
Protein per 100 calories
0.9g
4g
N/A
Calories per 10 g protein
1117kcal
253kcal
N/A
Weight per 100 calories
31g
37g
N/A
Unsaturated / Saturated Fat ratio
7.2
2.3
N/A
Net carbs
57.9g
49.68g
N/A
Sugar
27.42g
4.62g
N/A
Vitamin B12
0.01µg
0µg
0%
Trans fat
0.005g
N/A
Choline
8.9mg
8mg
0%
Tryptophan
0.042mg
0%
Threonine
0.102mg
0%
Isoleucine
0.121mg
0%
Leucine
0.206mg
0%
Lysine
0.121mg
0%
Methionine
0.059mg
0%
Phenylalanine
0.14mg
0%
Valine
0.144mg
0%
Histidine
0.071mg
0%
Omega-3 - DHA
0.001g
0g
N/A
Omega-3 - ALA
0.063g
N/A
Omega-6 - Gamma-linoleic acid
0.001g
N/A
Omega-6 - Linoleic acid
0.788g
N/A
Macronutrient Comparison
Macronutrient breakdown side-by-side comparison
2
3%
9%
62%
25%
Protein:
2.9 g
Fats:
9.1 g
Carbs:
61.6 g
Water:
25.3 g
Other:
1.1 g
3
11%
2%
52%
33%
2%
Protein:
10.75 g
Fats:
2.42 g
Carbs:
51.88 g
Water:
33 g
Other:
1.95 g
Contains
more
Fats Fats
+276%
Contains
more
Carbs Carbs
+18.7%
Contains
more
Protein Protein
+270.7%
Contains
more
Water Water
+30.4%
Contains
more
Other Other
+77.3%
Fat Type Comparison
Fat type breakdown side-by-side comparison
2
12%
49%
39%
Saturated fat:
Sat. Fat
1.048 g
Monounsaturated fat:
Mono. Fat
4.2 g
Polyunsaturated fat:
Poly. Fat
3.323 g
1
30%
21%
49%
Saturated fat:
Sat. Fat
0.529 g
Monounsaturated fat:
Mono. Fat
0.362 g
Polyunsaturated fat:
Poly. Fat
0.855 g
Contains
more
Mono. Fat Monounsaturated fat
+1060.2%
Contains
more
Poly. Fat Polyunsaturated fat
+288.7%
Contains
less
Sat. Fat Saturated fat
-49.5%