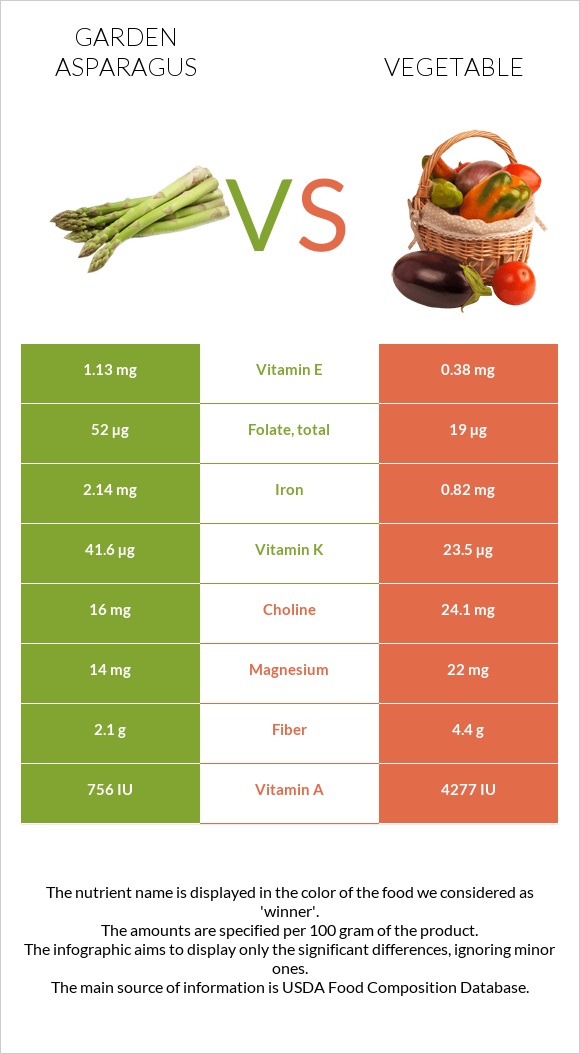
A recap on the differences between asparagus and vegetable Asparagus has more iron, vitamin K, copper, folate, and vitamin B1; however, vegetable is higher in vitamin A, manganese, and fiber. Vegetable covers your daily vitamin A needs 70% more than asparagus. Vegetable contains 3 times less vitamin E than asparagus. Asparagus contains 1.13mg of vitamin E, while vegetable contains 0.38mg. The glycemic index of vegetable is higher. Food varieties used in this article are Asparagus, raw and Vegetables, mixed, frozen, cooked, boiled, drained, without salt .
Infographic
Mineral Comparison
Mineral comparison score is based on the number of minerals by which one or the other food is richer. The "coverage" charts below show how much of the daily needs can be covered by 300 grams of the food.
5
100 g
300 g
1 spear tip (2" long or less) - 3.5g 1 spear, small (5" long or less) - 12g 1 spear, medium (5-1/4" to 7" long) - 16g 1 spear, large (7-1/4" to 8-1/2") - 20g 1 spear, extra large (8-3/4" to 10" long) - 24g 1 cup - 134g
Magnesium
Magnesium
Calcium
Calcium
Potassium
Potassium
Iron
Iron
Copper
Copper
Zinc
Zinc
Phosphorus
Phosphorus
Sodium
Sodium
Manganese
Manganese
Selenium
Selenium
10%
7.2%
18%
80%
63%
15%
22%
0.26%
21%
13%
2
100 g
300 g
0.5 cup - 91g 1 package (10 oz) yields - 275g
Magnesium
Magnesium
Calcium
Calcium
Potassium
Potassium
Iron
Iron
Copper
Copper
Zinc
Zinc
Phosphorus
Phosphorus
Sodium
Sodium
Manganese
Manganese
Selenium
Selenium
16%
7.5%
15%
31%
28%
13%
22%
4.6%
49%
1.6%
Vitamin Comparison
Vitamin comparison score is based on the number of vitamins by which one or the other food is richer. The "coverage" charts below show how much of the daily needs can be covered by 300 grams of the food.
9
100 g
300 g
1 spear tip (2" long or less) - 3.5g 1 spear, small (5" long or less) - 12g 1 spear, medium (5-1/4" to 7" long) - 16g 1 spear, large (7-1/4" to 8-1/2") - 20g 1 spear, extra large (8-3/4" to 10" long) - 24g 1 cup - 134g
Vitamin C
Vit. C
Vitamin D
Vit. D
Vitamin A
Vit. A
Vitamin E
Vit. E
Vitamin B1
Vit. B1
Vitamin B2
Vit. B2
Vitamin B3
Vit. B3
Vitamin B5
Vit. B5
Vitamin B6
Vit. B6
Vitamin B12
Vit. B12
Vitamin K
Vit. K
Folate
Folate
19%
0%
13%
23%
36%
33%
18%
16%
21%
0%
104%
39%
1
100 g
300 g
0.5 cup - 91g 1 package (10 oz) yields - 275g
Vitamin C
Vit. C
Vitamin D
Vit. D
Vitamin A
Vit. A
Vitamin E
Vit. E
Vitamin B1
Vit. B1
Vitamin B2
Vit. B2
Vitamin B3
Vit. B3
Vitamin B5
Vit. B5
Vitamin B6
Vit. B6
Vitamin B12
Vit. B12
Vitamin K
Vit. K
Folate
Folate
11%
0%
71%
7.6%
18%
28%
16%
9.1%
17%
0%
59%
14%
All nutrients comparison - raw data values
Nutrient
DV% diff.
Vitamin A
38µg
214µg
20%
Iron
2.14mg
0.82mg
17%
Vitamin K
41.6µg
23.5µg
15%
Copper
0.189mg
0.083mg
12%
Manganese
0.158mg
0.379mg
10%
Fiber
2.1g
4.4g
9%
Folate
52µg
19µg
8%
Vitamin B1
0.143mg
0.071mg
6%
Vitamin E
1.13mg
0.38mg
5%
Selenium
2.3µg
0.3µg
4%
Vitamin C
5.6mg
3.2mg
3%
Carbs
3.88g
13.09g
3%
Calories
20kcal
65kcal
2%
Magnesium
14mg
22mg
2%
Vitamin B2
0.141mg
0.12mg
2%
Vitamin B5
0.274mg
0.151mg
2%
Protein
2.2g
2.86g
1%
Potassium
202mg
169mg
1%
Sodium
2mg
35mg
1%
Vitamin B3
0.978mg
0.851mg
1%
Vitamin B6
0.091mg
0.074mg
1%
Choline
16mg
24.1mg
1%
Fructose
1g
1%
Protein per 100 calories
11g
4.4g
N/A
Calories per 10 g protein
91kcal
227kcal
N/A
Weight per 100 calories
500g
154g
N/A
Fats
0.12g
0.15g
0%
Net carbs
1.78g
8.69g
N/A
Calcium
24mg
25mg
0%
Sugar
1.88g
3.12g
N/A
Zinc
0.54mg
0.49mg
0%
Phosphorus
52mg
51mg
0%
Saturated fat
0.04g
0.031g
0%
Monounsaturated fat
0g
0.01g
0%
Polyunsaturated fat
0.05g
0.072g
0%
Tryptophan
0.027mg
0.029mg
0%
Threonine
0.084mg
0.115mg
0%
Isoleucine
0.075mg
0.139mg
0%
Leucine
0.128mg
0.19mg
0%
Lysine
0.104mg
0.17mg
0%
Methionine
0.031mg
0.034mg
0%
Phenylalanine
0.075mg
0.12mg
0%
Valine
0.115mg
0.149mg
0%
Histidine
0.049mg
0.073mg
0%
Macronutrient Comparison
Macronutrient breakdown side-by-side comparison
1
2%
4%
93%
Protein:
2.2 g
Fats:
0.12 g
Carbs:
3.88 g
Water:
93.22 g
Other:
0.58 g
4
3%
13%
83%
Protein:
2.86 g
Fats:
0.15 g
Carbs:
13.09 g
Water:
83.23 g
Other:
0.67 g
Contains
more
Water Water
+12%
Contains
more
Protein Protein
+30%
Contains
more
Fats Fats
+25%
Contains
more
Carbs Carbs
+237.4%
Contains
more
Other Other
+15.5%
Fat Type Comparison
Fat type breakdown side-by-side comparison
0
44%
56%
Saturated fat:
Sat. Fat
0.04 g
Monounsaturated fat:
Mono. Fat
0 g
Polyunsaturated fat:
Poly. Fat
0.05 g
3
27%
9%
64%
Saturated fat:
Sat. Fat
0.031 g
Monounsaturated fat:
Mono. Fat
0.01 g
Polyunsaturated fat:
Poly. Fat
0.072 g
Contains
less
Sat. Fat Saturated fat
-22.5%
Contains
more
Mono. Fat Monounsaturated fat
+∞%
Contains
more
Poly. Fat Polyunsaturated fat
+44%