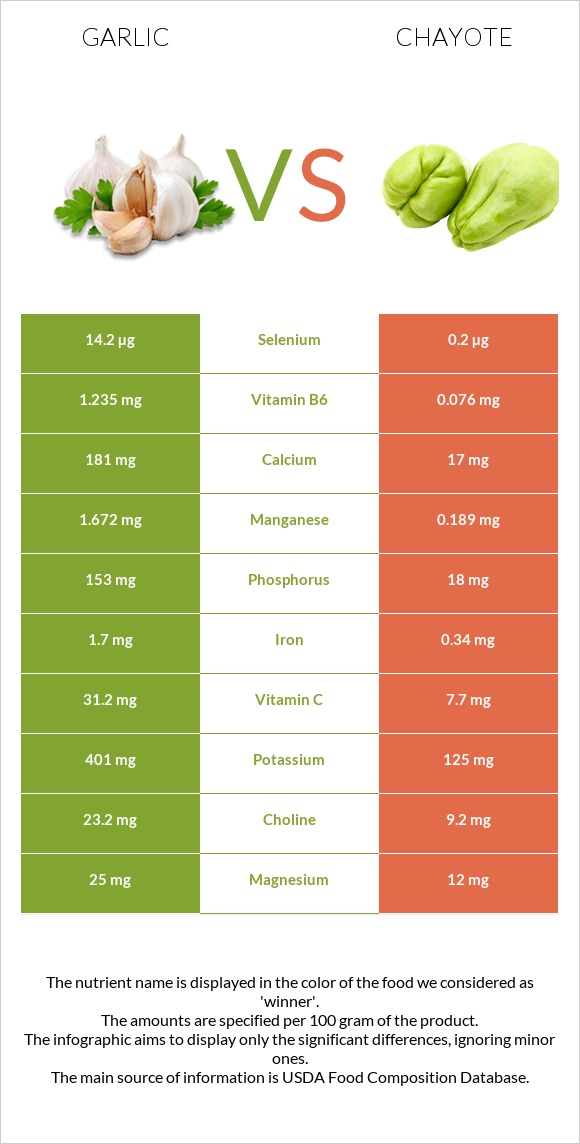
The main differences between garlic and chayote Garlic is richer in vitamin B6, manganese, vitamin C, selenium, copper, phosphorus, iron, calcium, and vitamin B1, yet chayote is richer in folate. Daily need coverage for vitamin B6 for garlic is 89% higher. Garlic contains 71 times more selenium than chayote. Garlic contains 14.2µg of selenium, while chayote contains 0.2µg. Food types used in this article are Garlic, raw and Chayote, fruit, raw .
Infographic
Mineral Comparison
Mineral comparison score is based on the number of minerals by which one or the other food is richer. The "coverage" charts below show how much of the daily needs can be covered by 300 grams of the food.
9
100 g
300 g
1 tsp - 2.8g 1 clove - 3g 3 cloves - 9g 1 cup - 136g
Magnesium
Magnesium
Calcium
Calcium
Potassium
Potassium
Iron
Iron
Copper
Copper
Zinc
Zinc
Phosphorus
Phosphorus
Sodium
Sodium
Manganese
Manganese
Selenium
Selenium
18%
54%
35%
64%
100%
32%
66%
2.2%
218%
77%
1
100 g
300 g
1 cup (1" pieces) - 132g 1 chayote (5-3/4") - 203g
Magnesium
Magnesium
Calcium
Calcium
Potassium
Potassium
Iron
Iron
Copper
Copper
Zinc
Zinc
Phosphorus
Phosphorus
Sodium
Sodium
Manganese
Manganese
Selenium
Selenium
8.6%
5.1%
11%
13%
41%
20%
7.7%
0.26%
25%
1.1%
Vitamin Comparison
Vitamin comparison score is based on the number of vitamins by which one or the other food is richer. The "coverage" charts below show how much of the daily needs can be covered by 300 grams of the food.
6
100 g
300 g
1 tsp - 2.8g 1 clove - 3g 3 cloves - 9g 1 cup - 136g
Vitamin C
Vit. C
Vitamin D
Vit. D
Vitamin A
Vit. A
Vitamin E
Vit. E
Vitamin B1
Vit. B1
Vitamin B2
Vit. B2
Vitamin B3
Vit. B3
Vitamin B5
Vit. B5
Vitamin B6
Vit. B6
Vitamin B12
Vit. B12
Vitamin K
Vit. K
Folate
Folate
104%
0%
0%
1.6%
50%
25%
13%
36%
285%
0%
4.3%
2.3%
3
100 g
300 g
1 cup (1" pieces) - 132g 1 chayote (5-3/4") - 203g
Vitamin C
Vit. C
Vitamin D
Vit. D
Vitamin A
Vit. A
Vitamin E
Vit. E
Vitamin B1
Vit. B1
Vitamin B2
Vit. B2
Vitamin B3
Vit. B3
Vitamin B5
Vit. B5
Vitamin B6
Vit. B6
Vitamin B12
Vit. B12
Vitamin K
Vit. K
Folate
Folate
26%
0%
0%
2.4%
6.3%
6.7%
8.8%
15%
18%
0%
10%
70%
All nutrients comparison - raw data values
Nutrient
DV% diff.
Vitamin B6
1.235mg
0.076mg
89%
Manganese
1.672mg
0.189mg
64%
Vitamin C
31.2mg
7.7mg
26%
Selenium
14.2µg
0.2µg
25%
Folate
3µg
93µg
23%
Copper
0.299mg
0.123mg
20%
Phosphorus
153mg
18mg
19%
Iron
1.7mg
0.34mg
17%
Calcium
181mg
17mg
16%
Vitamin B1
0.2mg
0.025mg
15%
Protein
6.36g
0.82g
11%
Carbs
33.06g
4.51g
10%
Potassium
401mg
125mg
8%
Calories
149kcal
19kcal
7%
Vitamin B5
0.596mg
0.249mg
7%
Vitamin B2
0.11mg
0.029mg
6%
Zinc
1.16mg
0.74mg
4%
Magnesium
25mg
12mg
3%
Choline
23.2mg
9.2mg
3%
Fiber
2.1g
1.7g
2%
Vitamin K
1.7µg
4.1µg
2%
Fats
0.5g
0.13g
1%
Sodium
17mg
2mg
1%
Vitamin B3
0.7mg
0.47mg
1%
Polyunsaturated fat
0.249g
0.057g
1%
Protein per 100 calories
4.3g
4.3g
N/A
Calories per 10 g protein
234kcal
232kcal
N/A
Weight per 100 calories
67g
526g
N/A
Net carbs
30.96g
2.81g
N/A
Sugar
1g
1.66g
N/A
Vitamin E
0.08mg
0.12mg
0%
Saturated fat
0.089g
0.028g
0%
Monounsaturated fat
0.011g
0.01g
0%
Tryptophan
0.066mg
0.011mg
0%
Threonine
0.157mg
0.04mg
0%
Isoleucine
0.217mg
0.044mg
0%
Leucine
0.308mg
0.077mg
0%
Lysine
0.273mg
0.039mg
0%
Methionine
0.076mg
0.001mg
0%
Phenylalanine
0.183mg
0.047mg
0%
Valine
0.291mg
0.063mg
0%
Histidine
0.113mg
0.015mg
0%
Macronutrient Comparison
Macronutrient breakdown side-by-side comparison
4
6%
33%
59%
Protein:
6.36 g
Fats:
0.5 g
Carbs:
33.06 g
Water:
58.58 g
Other:
1.5 g
1
5%
94%
Protein:
0.82 g
Fats:
0.13 g
Carbs:
4.51 g
Water:
94.24 g
Other:
0.3 g
Contains
more
Protein Protein
+675.6%
Contains
more
Fats Fats
+284.6%
Contains
more
Carbs Carbs
+633%
Contains
more
Other Other
+400%
Contains
more
Water Water
+60.9%
Fat Type Comparison
Fat type breakdown side-by-side comparison
2
26%
3%
71%
Saturated fat:
Sat. Fat
0.089 g
Monounsaturated fat:
Mono. Fat
0.011 g
Polyunsaturated fat:
Poly. Fat
0.249 g
1
29%
11%
60%
Saturated fat:
Sat. Fat
0.028 g
Monounsaturated fat:
Mono. Fat
0.01 g
Polyunsaturated fat:
Poly. Fat
0.057 g
Contains
more
Poly. Fat Polyunsaturated fat
+336.8%
Contains
less
Sat. Fat Saturated fat
-68.5%
~equal in
Monounsaturated fat
~0.01g