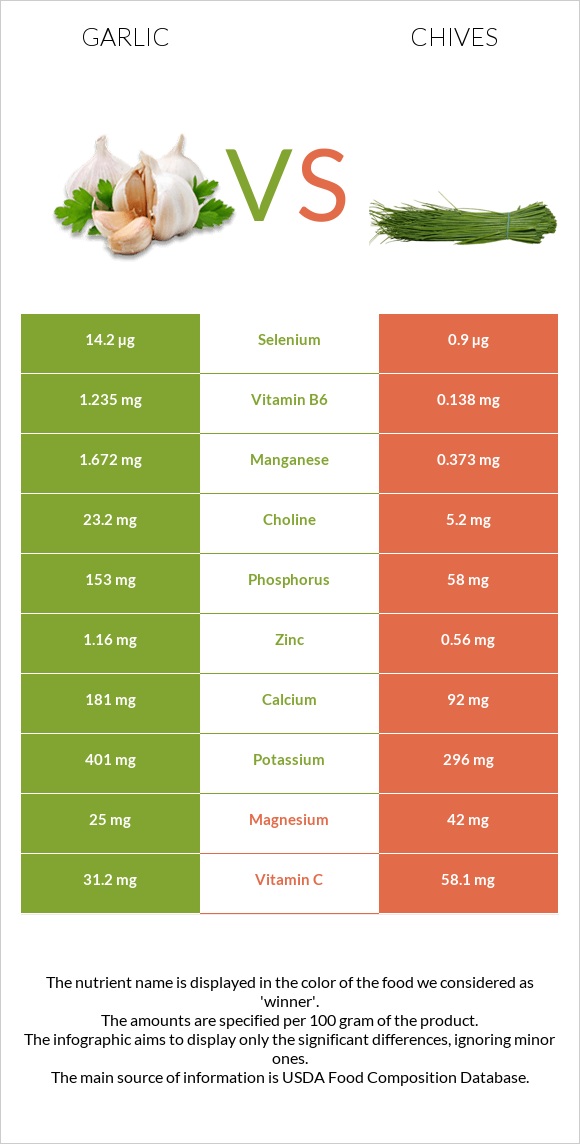
Differences between garlic and chives Garlic has more vitamin B6, manganese, selenium, copper, phosphorus, and vitamin B1, while chives have more vitamin K, vitamin A, vitamin C, and folate. Chives' daily need coverage for vitamin K is 176% higher. Chives contain 16 times less selenium than garlic. Garlic contains 14.2µg of selenium, while chives contain 0.9µg. Garlic has a lower glycemic index. The glycemic index of garlic is 30, while the glycemic index of chives is 45. The food types used in this comparison are Garlic, raw and Chives, raw .
Infographic
Mineral Comparison
Mineral comparison score is based on the number of minerals by which one or the other food is richer. The "coverage" charts below show how much of the daily needs can be covered by 300 grams of the food.
7
100 g
300 g
1 tsp - 2.8g 1 clove - 3g 3 cloves - 9g 1 cup - 136g
Magnesium
Magnesium
Calcium
Calcium
Potassium
Potassium
Iron
Iron
Copper
Copper
Zinc
Zinc
Phosphorus
Phosphorus
Sodium
Sodium
Manganese
Manganese
Selenium
Selenium
18%
54%
35%
64%
100%
32%
66%
2.2%
218%
77%
2
100 g
300 g
1 tsp chopped - 1g 1 tbsp chopped - 3g
Magnesium
Magnesium
Calcium
Calcium
Potassium
Potassium
Iron
Iron
Copper
Copper
Zinc
Zinc
Phosphorus
Phosphorus
Sodium
Sodium
Manganese
Manganese
Selenium
Selenium
30%
28%
26%
60%
52%
15%
25%
0.39%
49%
4.9%
Vitamin Comparison
Vitamin comparison score is based on the number of vitamins by which one or the other food is richer. The "coverage" charts below show how much of the daily needs can be covered by 300 grams of the food.
3
100 g
300 g
1 tsp - 2.8g 1 clove - 3g 3 cloves - 9g 1 cup - 136g
Vitamin C
Vit. C
Vitamin D
Vit. D
Vitamin A
Vit. A
Vitamin E
Vit. E
Vitamin B1
Vit. B1
Vitamin B2
Vit. B2
Vitamin B3
Vit. B3
Vitamin B5
Vit. B5
Vitamin B6
Vit. B6
Vitamin B12
Vit. B12
Vitamin K
Vit. K
Folate
Folate
104%
0%
0%
1.6%
50%
25%
13%
36%
285%
0%
4.3%
2.3%
5
100 g
300 g
1 tsp chopped - 1g 1 tbsp chopped - 3g
Vitamin C
Vit. C
Vitamin D
Vit. D
Vitamin A
Vit. A
Vitamin E
Vit. E
Vitamin B1
Vit. B1
Vitamin B2
Vit. B2
Vitamin B3
Vit. B3
Vitamin B5
Vit. B5
Vitamin B6
Vit. B6
Vitamin B12
Vit. B12
Vitamin K
Vit. K
Folate
Folate
194%
0%
73%
4.2%
20%
27%
12%
19%
32%
0%
532%
79%
All nutrients comparison - raw data values
Nutrient
DV% diff.
Vitamin K
1.7µg
212.7µg
176%
Vitamin B6
1.235mg
0.138mg
84%
Manganese
1.672mg
0.373mg
56%
Vitamin C
31.2mg
58.1mg
30%
Folate
3µg
105µg
26%
Vitamin A
0µg
218µg
24%
Selenium
14.2µg
0.9µg
24%
Copper
0.299mg
0.157mg
16%
Phosphorus
153mg
58mg
14%
Carbs
33.06g
4.35g
10%
Vitamin B1
0.2mg
0.078mg
10%
Calcium
181mg
92mg
9%
Calories
149kcal
30kcal
6%
Protein
6.36g
3.27g
6%
Zinc
1.16mg
0.56mg
5%
Vitamin B5
0.596mg
0.324mg
5%
Magnesium
25mg
42mg
4%
Potassium
401mg
296mg
3%
Choline
23.2mg
5.2mg
3%
Fiber
2.1g
2.5g
2%
Iron
1.7mg
1.6mg
1%
Sodium
17mg
3mg
1%
Vitamin E
0.08mg
0.21mg
1%
Protein per 100 calories
4.3g
11g
N/A
Calories per 10 g protein
234kcal
92kcal
N/A
Weight per 100 calories
67g
333g
N/A
Fats
0.5g
0.73g
0%
Net carbs
30.96g
1.85g
N/A
Sugar
1g
1.85g
N/A
Vitamin B2
0.11mg
0.115mg
0%
Vitamin B3
0.7mg
0.647mg
0%
Saturated fat
0.089g
0.146g
0%
Monounsaturated fat
0.011g
0.095g
0%
Polyunsaturated fat
0.249g
0.267g
0%
Tryptophan
0.066mg
0.037mg
0%
Threonine
0.157mg
0.128mg
0%
Isoleucine
0.217mg
0.139mg
0%
Leucine
0.308mg
0.195mg
0%
Lysine
0.273mg
0.163mg
0%
Methionine
0.076mg
0.036mg
0%
Phenylalanine
0.183mg
0.105mg
0%
Valine
0.291mg
0.145mg
0%
Histidine
0.113mg
0.057mg
0%
Macronutrient Comparison
Macronutrient breakdown side-by-side comparison
3
6%
33%
59%
Protein:
6.36 g
Fats:
0.5 g
Carbs:
33.06 g
Water:
58.58 g
Other:
1.5 g
2
3%
4%
91%
Protein:
3.27 g
Fats:
0.73 g
Carbs:
4.35 g
Water:
90.65 g
Other:
1 g
Contains
more
Protein Protein
+94.5%
Contains
more
Carbs Carbs
+660%
Contains
more
Other Other
+50%
Contains
more
Fats Fats
+46%
Contains
more
Water Water
+54.7%
Fat Type Comparison
Fat type breakdown side-by-side comparison
1
26%
3%
71%
Saturated fat:
Sat. Fat
0.089 g
Monounsaturated fat:
Mono. Fat
0.011 g
Polyunsaturated fat:
Poly. Fat
0.249 g
2
29%
19%
53%
Saturated fat:
Sat. Fat
0.146 g
Monounsaturated fat:
Mono. Fat
0.095 g
Polyunsaturated fat:
Poly. Fat
0.267 g
Contains
less
Sat. Fat Saturated fat
-39%
Contains
more
Mono. Fat Monounsaturated fat
+763.6%
~equal in
Polyunsaturated fat
~0.267g