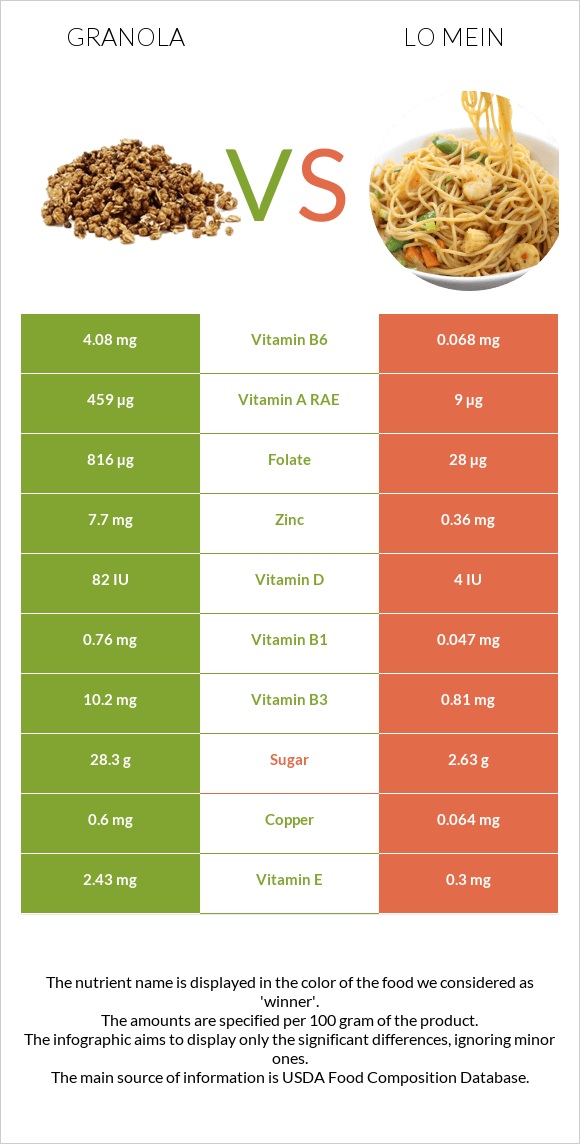
The main differences between granola and lo mein Granola is richer than lo mein in vitamin B12, vitamin B6, folate, zinc, copper, vitamin B1, vitamin B3, vitamin B2, iron, and vitamin A. Daily need coverage for vitamin B12 for granola is 500% higher. Granola contains 60 times more vitamin B6 than lo mein. Granola contains 4.08mg of vitamin B6, while lo mein contains 0.068mg. Food types used in this article are Cereals ready-to-eat, KELLOGG, KELLOGG'S Low Fat Granola without Raisins and Restaurant, Chinese, vegetable lo mein, without meat .
Infographic
Mineral Comparison
Mineral comparison score is based on the number of minerals by which one or the other food is richer. The "coverage" charts below show how much of the daily needs can be covered by 300 grams of the food.
9
100 g
300 g
0.5 cup (1 NLEA serving) - 49g
Magnesium
Magnesium
Calcium
Calcium
Potassium
Potassium
Iron
Iron
Copper
Copper
Zinc
Zinc
Phosphorus
Phosphorus
Sodium
Sodium
Manganese
Manganese
Selenium
Selenium
49%
9.9%
19%
139%
200%
210%
98%
34%
0%
94%
1
100 g
300 g
1 cup - 136g 1 order - 741g
Magnesium
Magnesium
Calcium
Calcium
Potassium
Potassium
Iron
Iron
Copper
Copper
Zinc
Zinc
Phosphorus
Phosphorus
Sodium
Sodium
Manganese
Manganese
Selenium
Selenium
10%
6.3%
9.3%
40%
21%
9.8%
19%
56%
31%
64%
Vitamin Comparison
Vitamin comparison score is based on the number of vitamins by which one or the other food is richer. The "coverage" charts below show how much of the daily needs can be covered by 300 grams of the food.
10
100 g
300 g
0.5 cup (1 NLEA serving) - 49g
Vitamin C
Vit. C
Vitamin D
Vit. D
Vitamin A
Vit. A
Vitamin E
Vit. E
Vitamin B1
Vit. B1
Vitamin B2
Vit. B2
Vitamin B3
Vit. B3
Vitamin B5
Vit. B5
Vitamin B6
Vit. B6
Vitamin B12
Vit. B12
Vitamin K
Vit. K
Folate
Folate
20%
32%
153%
49%
190%
201%
191%
0%
942%
1500%
3.3%
612%
2
100 g
300 g
1 cup - 136g 1 order - 741g
Vitamin C
Vit. C
Vitamin D
Vit. D
Vitamin A
Vit. A
Vitamin E
Vit. E
Vitamin B1
Vit. B1
Vitamin B2
Vit. B2
Vitamin B3
Vit. B3
Vitamin B5
Vit. B5
Vitamin B6
Vit. B6
Vitamin B12
Vit. B12
Vitamin K
Vit. K
Folate
Folate
5.7%
1.5%
3%
6%
12%
29%
15%
16%
16%
0%
32%
21%
All nutrients comparison - raw data values
Nutrient
DV% diff.
Vitamin B12
12µg
0µg
500%
Vitamin B6
4.08mg
0.068mg
309%
Folate
816µg
28µg
197%
Zinc
7.7mg
0.36mg
67%
Copper
0.6mg
0.064mg
60%
Vitamin B1
0.76mg
0.047mg
59%
Vitamin B3
10.2mg
0.81mg
59%
Vitamin B2
0.87mg
0.124mg
57%
Vitamin A
459µg
9µg
50%
Iron
3.7mg
1.07mg
33%
Phosphorus
228mg
45mg
26%
Fiber
7g
1.3g
23%
Carbs
80.9g
20.16g
20%
Vitamin E
2.43mg
0.3mg
14%
Calories
389kcal
121kcal
13%
Magnesium
68mg
14mg
13%
Vitamin D*
82 IU
4 IU
10%
Vitamin D
2.1µg
0.1µg
10%
Manganese
0.24mg
10%
Selenium
17.3µg
11.7µg
10%
Vitamin K
1.3µg
12.7µg
10%
Protein
8.7g
4.77g
8%
Sodium
257mg
430mg
8%
Starch
16.73g
7%
Fats
5.7g
2.35g
5%
Vitamin C
6mg
1.7mg
5%
Vitamin B5
0.27mg
5%
Monounsaturated fat
2.5g
0.592g
5%
Saturated fat
1.39g
0.464g
4%
Potassium
215mg
105mg
3%
Choline
22.6mg
8.9mg
2%
Polyunsaturated fat
1.6g
1.291g
2%
Calcium
33mg
21mg
1%
Protein per 100 calories
2.2g
3.9g
N/A
Calories per 10 g protein
447kcal
254kcal
N/A
Weight per 100 calories
26g
83g
N/A
Unsaturated / Saturated Fat ratio
2.9
4.1
N/A
Net carbs
73.9g
18.86g
N/A
Sugar
28.3g
2.63g
N/A
Trans fat
0g
0.008g
N/A
Fructose
0.33g
0%
Omega-3 - ALA
0.141g
N/A
Omega-6 - Gamma-linoleic acid
0.004g
N/A
Omega-6 - Eicosadienoic acid
0.001g
N/A
Omega-6 - Linoleic acid
1.134g
N/A
Macronutrient Comparison
Macronutrient breakdown side-by-side comparison
3
9%
6%
81%
4%
Protein:
8.7 g
Fats:
5.7 g
Carbs:
80.9 g
Water:
3.5 g
Other:
1.2 g
2
5%
2%
20%
71%
Protein:
4.77 g
Fats:
2.35 g
Carbs:
20.16 g
Water:
71.33 g
Other:
1.39 g
Contains
more
Protein Protein
+82.4%
Contains
more
Fats Fats
+142.6%
Contains
more
Carbs Carbs
+301.3%
Contains
more
Water Water
+1938%
Contains
more
Other Other
+15.8%
Fat Type Comparison
Fat type breakdown side-by-side comparison
2
25%
46%
29%
Saturated fat:
Sat. Fat
1.39 g
Monounsaturated fat:
Mono. Fat
2.5 g
Polyunsaturated fat:
Poly. Fat
1.6 g
1
20%
25%
55%
Saturated fat:
Sat. Fat
0.464 g
Monounsaturated fat:
Mono. Fat
0.592 g
Polyunsaturated fat:
Poly. Fat
1.291 g
Contains
more
Mono. Fat Monounsaturated fat
+322.3%
Contains
more
Poly. Fat Polyunsaturated fat
+23.9%
Contains
less
Sat. Fat Saturated fat
-66.6%