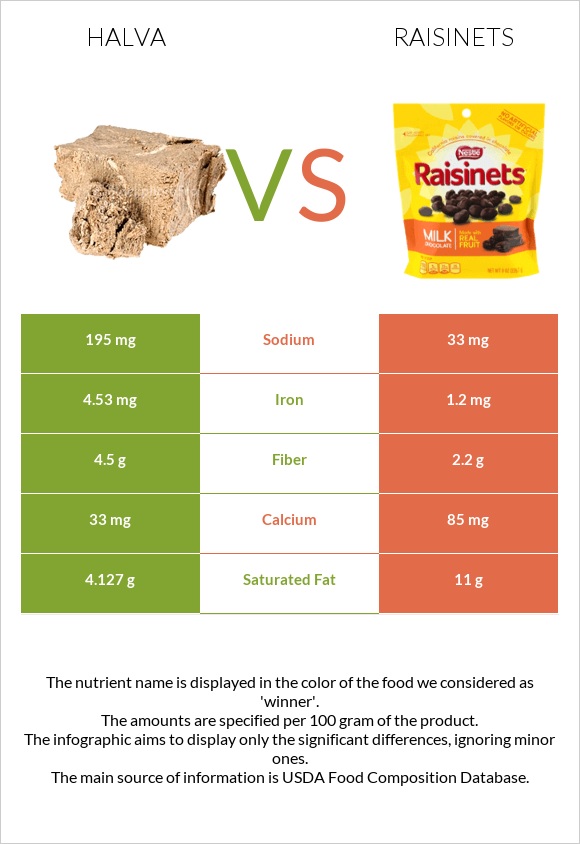
What are the main differences between halva and raisinets? Halva is richer in iron and fiber, while raisinets are higher in calcium. Halva's daily need coverage for iron is 42% higher. Raisinets have 6 times less sodium than halva. Halva has 195mg of sodium, while raisinets have 33mg. We used Candies, halavah, plain and Candies, NESTLE, RAISINETS Chocolate Covered Raisins types in this comparison.
Infographic
Mineral Comparison
Mineral comparison score is based on the number of minerals by which one or the other food is richer. The "coverage" charts below show how much of the daily needs can be covered by 300 grams of the food.
8
100 g
300 g
1 oz - 28.35g
Magnesium
Magnesium
Calcium
Calcium
Potassium
Potassium
Iron
Iron
Copper
Copper
Zinc
Zinc
Phosphorus
Phosphorus
Sodium
Sodium
Manganese
Manganese
Selenium
Selenium
156%
9.9%
17%
170%
401%
118%
260%
25%
114%
63%
2
100 g
300 g
1 serving 1.58 oz bag - 45g 1 serving 0.25 cup - 45g 1 serving fun size - 48g
Magnesium
Magnesium
Calcium
Calcium
Potassium
Potassium
Iron
Iron
Copper
Copper
Zinc
Zinc
Phosphorus
Phosphorus
Sodium
Sodium
Manganese
Manganese
Selenium
Selenium
0%
26%
0%
45%
0%
0%
0%
4.3%
0%
0%
Vitamin Comparison
Vitamin comparison score is based on the number of vitamins by which one or the other food is richer. The "coverage" charts below show how much of the daily needs can be covered by 300 grams of the food.
7
100 g
300 g
1 oz - 28.35g
Vitamin C
Vit. C
Vitamin D
Vit. D
Vitamin A
Vit. A
Vitamin E
Vit. E
Vitamin B1
Vit. B1
Vitamin B2
Vit. B2
Vitamin B3
Vit. B3
Vitamin B5
Vit. B5
Vitamin B6
Vit. B6
Vitamin B12
Vit. B12
Vitamin K
Vit. K
Folate
Folate
0.33%
0%
0%
0%
106%
20%
54%
10%
80%
5%
0%
49%
1
100 g
300 g
1 serving 1.58 oz bag - 45g 1 serving 0.25 cup - 45g 1 serving fun size - 48g
Vitamin C
Vit. C
Vitamin D
Vit. D
Vitamin A
Vit. A
Vitamin E
Vit. E
Vitamin B1
Vit. B1
Vitamin B2
Vit. B2
Vitamin B3
Vit. B3
Vitamin B5
Vit. B5
Vitamin B6
Vit. B6
Vitamin B12
Vit. B12
Vitamin K
Vit. K
Folate
Folate
5.3%
0%
0%
0%
0%
0%
0%
0%
0%
0%
0%
0%
All nutrients comparison - raw data values
Nutrient
DV% diff.
Copper
1.202mg
134%
Phosphorus
607mg
87%
Polyunsaturated fat
8.481g
57%
Magnesium
218mg
52%
Iron
4.53mg
1.2mg
42%
Zinc
4.32mg
39%
Manganese
0.873mg
38%
Vitamin B1
0.424mg
35%
Saturated fat
4.127g
11g
31%
Vitamin B6
0.348mg
27%
Selenium
11.5µg
21%
Monounsaturated fat
8.194g
20%
Vitamin B3
2.856mg
18%
Protein
12.49g
4.4g
16%
Folate
65µg
16%
Fiber
4.5g
2.2g
9%
Fats
21.52g
17g
7%
Sodium
195mg
33mg
7%
Vitamin B2
0.088mg
7%
Potassium
187mg
6%
Calcium
33mg
85mg
5%
Carbs
60.49g
71g
4%
Cholesterol
0mg
11mg
4%
Vitamin B5
0.174mg
3%
Calories
469kcal
422kcal
2%
Vitamin C
0.1mg
1.6mg
2%
Vitamin B12
0.04µg
2%
Protein per 100 calories
2.7g
1g
N/A
Calories per 10 g protein
376kcal
959kcal
N/A
Weight per 100 calories
21g
24g
N/A
Unsaturated / Saturated Fat ratio
4
0
N/A
Net carbs
55.99g
68.8g
N/A
Sugar
59g
N/A
Trans fat
0.08g
N/A
Macronutrient Comparison
Macronutrient breakdown side-by-side comparison
3
12%
22%
60%
4%
2%
Protein:
12.49 g
Fats:
21.52 g
Carbs:
60.49 g
Water:
3.67 g
Other:
1.83 g
2
4%
17%
71%
6%
Protein:
4.4 g
Fats:
17 g
Carbs:
71 g
Water:
6.4 g
Other:
1.2 g
Contains
more
Protein Protein
+183.9%
Contains
more
Fats Fats
+26.6%
Contains
more
Other Other
+52.5%
Contains
more
Carbs Carbs
+17.4%
Contains
more
Water Water
+74.4%
Fat Type Comparison
Fat type breakdown side-by-side comparison
3
20%
39%
41%
Saturated fat:
Sat. Fat
4.127 g
Monounsaturated fat:
Mono. Fat
8.194 g
Polyunsaturated fat:
Poly. Fat
8.481 g
0
100%
Saturated fat:
Sat. Fat
11 g
Monounsaturated fat:
Mono. Fat
0 g
Polyunsaturated fat:
Poly. Fat
0 g
Contains
less
Sat. Fat Saturated fat
-62.5%
Contains
more
Mono. Fat Monounsaturated fat
+∞%
Contains
more
Poly. Fat Polyunsaturated fat
+∞%