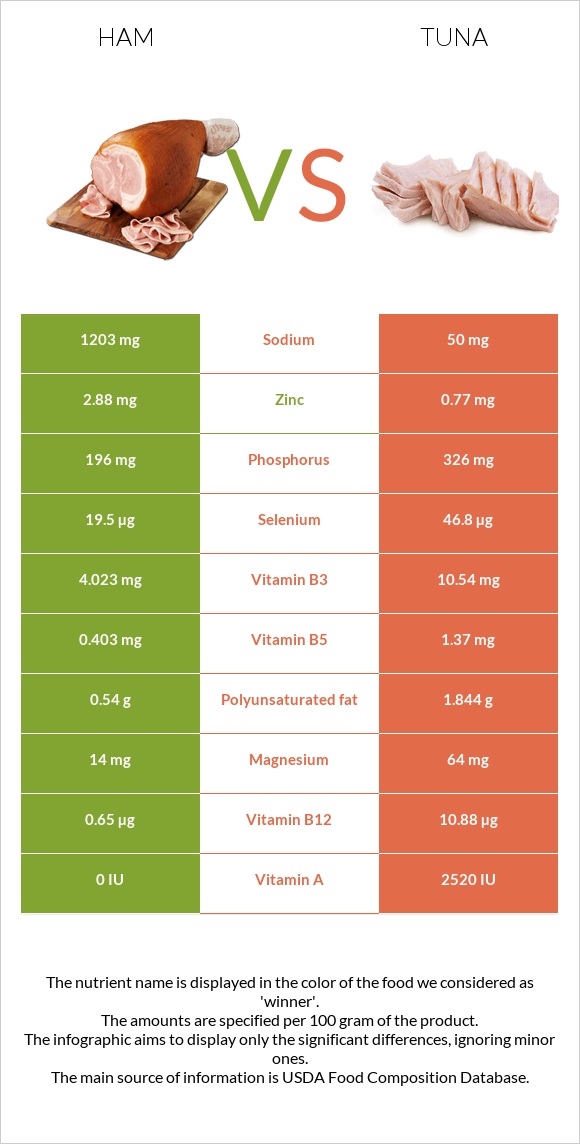
A recap on the differences between ham and tuna Ham has more vitamin B1 and zinc; however, tuna is higher in selenium, vitamin B3, vitamin B12, vitamin B6, phosphorus, and potassium. Tuna covers your daily selenium needs 161% more than ham. Tuna contains 22 times less sodium than ham. Ham contains 1203mg of sodium, while tuna contains 54mg. Food varieties used in this article are Pork, cured, ham, boneless, extra lean (approximately 5% fat), roasted and Fish, tuna, yellowfin, fresh, cooked, dry heat .
Infographic
Mineral Comparison
Mineral comparison score is based on the number of minerals by which one or the other food is richer. The "coverage" charts below show how much of the daily needs can be covered by 300 grams of the food.
5
100 g
300 g
3 oz - 85g 1 cup - 140g
Magnesium
Magnesium
Calcium
Calcium
Potassium
Potassium
Iron
Iron
Copper
Copper
Zinc
Zinc
Phosphorus
Phosphorus
Sodium
Sodium
Manganese
Manganese
Selenium
Selenium
10%
2.4%
25%
56%
26%
79%
84%
157%
7%
106%
5
100 g
300 g
3 oz - 85g
Magnesium
Magnesium
Calcium
Calcium
Potassium
Potassium
Iron
Iron
Copper
Copper
Zinc
Zinc
Phosphorus
Phosphorus
Sodium
Sodium
Manganese
Manganese
Selenium
Selenium
30%
1.2%
47%
35%
14%
12%
143%
7%
1.7%
590%
Vitamin Comparison
Vitamin comparison score is based on the number of vitamins by which one or the other food is richer. The "coverage" charts below show how much of the daily needs can be covered by 300 grams of the food.
4
100 g
300 g
3 oz - 85g 1 cup - 140g
Vitamin C
Vit. C
Vitamin D
Vit. D
Vitamin A
Vit. A
Vitamin E
Vit. E
Vitamin B1
Vit. B1
Vitamin B2
Vit. B2
Vitamin B3
Vit. B3
Vitamin B5
Vit. B5
Vitamin B6
Vit. B6
Vitamin B12
Vit. B12
Vitamin K
Vit. K
Folate
Folate
0%
12%
0%
5%
189%
47%
75%
24%
92%
81%
0%
2.3%
7
100 g
300 g
3 oz - 85g
Vitamin C
Vit. C
Vitamin D
Vit. D
Vitamin A
Vit. A
Vitamin E
Vit. E
Vitamin B1
Vit. B1
Vitamin B2
Vit. B2
Vitamin B3
Vit. B3
Vitamin B5
Vit. B5
Vitamin B6
Vit. B6
Vitamin B12
Vit. B12
Vitamin K
Vit. K
Folate
Folate
0%
30%
7.3%
5.8%
34%
32%
414%
20%
240%
294%
0.25%
1.5%
All nutrients comparison - raw data values
Nutrient
DV% diff.
Selenium
19.5µg
108.2µg
161%
Vitamin B3
4.023mg
22.07mg
113%
Vitamin B12
0.65µg
2.35µg
71%
Vitamin B1
0.754mg
0.134mg
52%
Sodium
1203mg
54mg
50%
Vitamin B6
0.4mg
1.038mg
49%
Zinc
2.88mg
0.45mg
22%
Phosphorus
196mg
333mg
20%
Protein
20.93g
29.15g
16%
Fats
5.53g
0.59g
8%
Magnesium
14mg
42mg
7%
Potassium
287mg
527mg
7%
Iron
1.48mg
0.92mg
7%
Saturated fat
1.81g
0.205g
7%
Vitamin D*
32 IU
82 IU
6%
Vitamin D
0.8µg
2µg
6%
Monounsaturated fat
2.62g
0.138g
6%
Vitamin B2
0.202mg
0.137mg
5%
Copper
0.079mg
0.043mg
4%
Cholesterol
53mg
47mg
2%
Vitamin A
0µg
22µg
2%
Manganese
0.054mg
0.013mg
2%
Polyunsaturated fat
0.54g
0.175g
2%
Calories
145kcal
130kcal
1%
Carbs
1.5g
0g
1%
Vitamin B5
0.403mg
0.334mg
1%
Choline
85.1mg
77.6mg
1%
Protein per 100 calories
14g
22g
N/A
Calories per 10 g protein
69kcal
45kcal
N/A
Weight per 100 calories
69g
77g
N/A
Unsaturated / Saturated Fat ratio
1.7
1.5
N/A
Net carbs
1.5g
0g
N/A
Calcium
8mg
4mg
0%
Vitamin E
0.25mg
0.29mg
0%
Vitamin K
0µg
0.1µg
0%
Folate
3µg
2µg
0%
Trans fat
0.02g
N/A
Tryptophan
0.251mg
0.313mg
0%
Threonine
0.931mg
1.224mg
0%
Isoleucine
0.918mg
1.287mg
0%
Leucine
1.661mg
2.27mg
0%
Lysine
1.775mg
2.565mg
0%
Methionine
0.553mg
0.827mg
0%
Phenylalanine
0.904mg
1.091mg
0%
Valine
0.908mg
1.438mg
0%
Histidine
0.75mg
0.822mg
0%
Omega-3 - EPA
0g
0.015g
N/A
Omega-3 - DHA
0g
0.105g
N/A
Omega-3 - DPA
0g
0.005g
N/A
Omega-6 - Eicosadienoic acid
0.002g
N/A
Macronutrient Comparison
Macronutrient breakdown side-by-side comparison
3
21%
6%
68%
4%
Protein:
20.93 g
Fats:
5.53 g
Carbs:
1.5 g
Water:
67.67 g
Other:
4.37 g
2
29%
69%
Protein:
29.15 g
Fats:
0.59 g
Carbs:
0 g
Water:
68.98 g
Other:
1.28 g
Contains
more
Fats Fats
+837.3%
Contains
more
Carbs Carbs
+∞%
Contains
more
Other Other
+241.4%
Contains
more
Protein Protein
+39.3%
Fat Type Comparison
Fat type breakdown side-by-side comparison
2
36%
53%
11%
Saturated fat:
Sat. Fat
1.81 g
Monounsaturated fat:
Mono. Fat
2.62 g
Polyunsaturated fat:
Poly. Fat
0.54 g
1
40%
27%
34%
Saturated fat:
Sat. Fat
0.205 g
Monounsaturated fat:
Mono. Fat
0.138 g
Polyunsaturated fat:
Poly. Fat
0.175 g
Contains
more
Mono. Fat Monounsaturated fat
+1798.6%
Contains
more
Poly. Fat Polyunsaturated fat
+208.6%
Contains
less
Sat. Fat Saturated fat
-88.7%