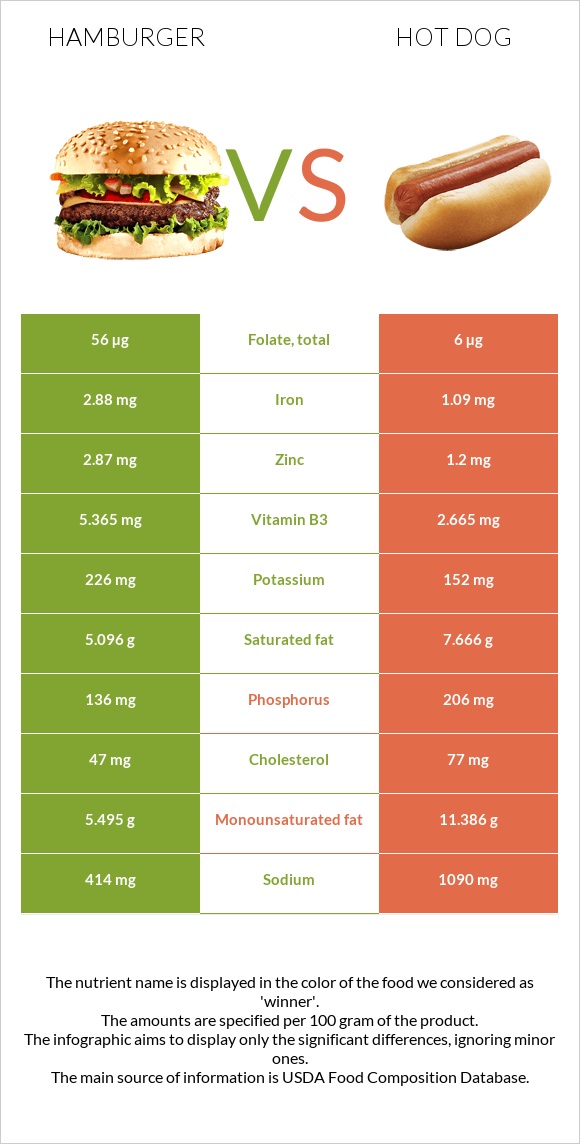
Significant differences between hamburgers and hot dogs Hamburgers are richer in iron, vitamin B3, zinc, vitamin B1, folate, and vitamin B2, while hot dogs are higher in phosphorus. Hot dogs cover your daily sodium needs 29% more than hamburgers. Hamburgers have 9 times more folate than hot dogs. Hamburgers have 56µg of folate, while hot dogs have 6µg. Hamburgers are lower in saturated fat. Hamburgers have a higher glycemic index (66) than hot dogs (28). Specific food types used in this comparison are Fast foods, hamburger; double, regular, patty; plain and Frankfurter, meat .
Infographic
Mineral Comparison
Mineral comparison score is based on the number of minerals by which one or the other food is richer. The "coverage" charts below show how much of the daily needs can be covered by 300 grams of the food.
6
100 g
300 g
1 item - 120g
Magnesium
Magnesium
Calcium
Calcium
Potassium
Potassium
Iron
Iron
Copper
Copper
Zinc
Zinc
Phosphorus
Phosphorus
Sodium
Sodium
Manganese
Manganese
Selenium
Selenium
14%
31%
20%
108%
30%
78%
58%
54%
28%
0%
2
100 g
300 g
1 serving (1 hot dog) - 52g
Magnesium
Magnesium
Calcium
Calcium
Potassium
Potassium
Iron
Iron
Copper
Copper
Zinc
Zinc
Phosphorus
Phosphorus
Sodium
Sodium
Manganese
Manganese
Selenium
Selenium
11%
30%
13%
41%
32%
33%
88%
142%
5.9%
68%
Vitamin Comparison
Vitamin comparison score is based on the number of vitamins by which one or the other food is richer. The "coverage" charts below show how much of the daily needs can be covered by 300 grams of the food.
5
100 g
300 g
1 item - 120g
Vitamin C
Vit. C
Vitamin D
Vit. D
Vitamin A
Vit. A
Vitamin E
Vit. E
Vitamin B1
Vit. B1
Vitamin B2
Vit. B2
Vitamin B3
Vit. B3
Vitamin B5
Vit. B5
Vitamin B6
Vit. B6
Vitamin B12
Vit. B12
Vitamin K
Vit. K
Folate
Folate
0%
0%
0%
0%
54%
58%
101%
19%
47%
180%
0%
42%
1
100 g
300 g
1 serving (1 hot dog) - 52g
Vitamin C
Vit. C
Vitamin D
Vit. D
Vitamin A
Vit. A
Vitamin E
Vit. E
Vitamin B1
Vit. B1
Vitamin B2
Vit. B2
Vitamin B3
Vit. B3
Vitamin B5
Vit. B5
Vitamin B6
Vit. B6
Vitamin B12
Vit. B12
Vitamin K
Vit. K
Folate
Folate
0%
0%
0%
3.8%
14%
28%
50%
19%
38%
196%
0%
4.5%
All nutrients comparison - raw data values
Nutrient
DV% diff.
Sodium
414mg
1090mg
29%
Polyunsaturated fat
0.38g
4.404g
27%
Selenium
12.5µg
23%
Iron
2.88mg
1.09mg
22%
Fats
14.36g
25.76g
18%
Vitamin B3
5.365mg
2.665mg
17%
Zinc
2.87mg
1.2mg
15%
Monounsaturated fat
5.495g
11.386g
15%
Protein
17.08g
10.26g
14%
Vitamin B1
0.217mg
0.055mg
14%
Folate
56µg
6µg
13%
Saturated fat
5.096g
7.666g
12%
Cholesterol
47mg
77mg
10%
Phosphorus
136mg
206mg
10%
Vitamin B2
0.25mg
0.121mg
10%
Carbs
24.1g
4.17g
7%
Manganese
0.217mg
0.045mg
7%
Vitamin B12
1.44µg
1.57µg
5%
Fiber
0.9g
0g
4%
Vitamin B6
0.203mg
0.166mg
3%
Fructose
2.03g
3%
Potassium
226mg
152mg
2%
Magnesium
20mg
15mg
1%
Copper
0.091mg
0.097mg
1%
Vitamin E
0.19mg
1%
Calories
295kcal
290kcal
0%
Protein per 100 calories
5.8g
3.5g
N/A
Calories per 10 g protein
173kcal
283kcal
N/A
Weight per 100 calories
34g
34g
N/A
Unsaturated / Saturated Fat ratio
1.2
2.1
N/A
Net carbs
23.2g
4.17g
N/A
Calcium
102mg
99mg
0%
Sugar
4.15g
N/A
Vitamin B5
0.31mg
0.31mg
0%
Trans fat
0.814g
N/A
Tryptophan
0.206mg
0.111mg
0%
Threonine
0.666mg
0.474mg
0%
Isoleucine
0.716mg
0.53mg
0%
Leucine
1.319mg
0.907mg
0%
Lysine
1.226mg
0.963mg
0%
Methionine
0.37mg
0.291mg
0%
Phenylalanine
0.677mg
0.445mg
0%
Valine
0.823mg
0.555mg
0%
Histidine
0.505mg
0.331mg
0%
Macronutrient Comparison
Macronutrient breakdown side-by-side comparison
2
17%
14%
24%
43%
2%
Protein:
17.08 g
Fats:
14.36 g
Carbs:
24.1 g
Water:
42.67 g
Other:
1.79 g
3
10%
26%
4%
56%
4%
Protein:
10.26 g
Fats:
25.76 g
Carbs:
4.17 g
Water:
56.31 g
Other:
3.5 g
Contains
more
Protein Protein
+66.5%
Contains
more
Carbs Carbs
+477.9%
Contains
more
Fats Fats
+79.4%
Contains
more
Water Water
+32%
Contains
more
Other Other
+95.5%
Fat Type Comparison
Fat type breakdown side-by-side comparison
1
46%
50%
3%
Saturated fat:
Sat. Fat
5.096 g
Monounsaturated fat:
Mono. Fat
5.495 g
Polyunsaturated fat:
Poly. Fat
0.38 g
2
33%
49%
19%
Saturated fat:
Sat. Fat
7.666 g
Monounsaturated fat:
Mono. Fat
11.386 g
Polyunsaturated fat:
Poly. Fat
4.404 g
Contains
less
Sat. Fat Saturated fat
-33.5%
Contains
more
Mono. Fat Monounsaturated fat
+107.2%
Contains
more
Poly. Fat Polyunsaturated fat
+1058.9%