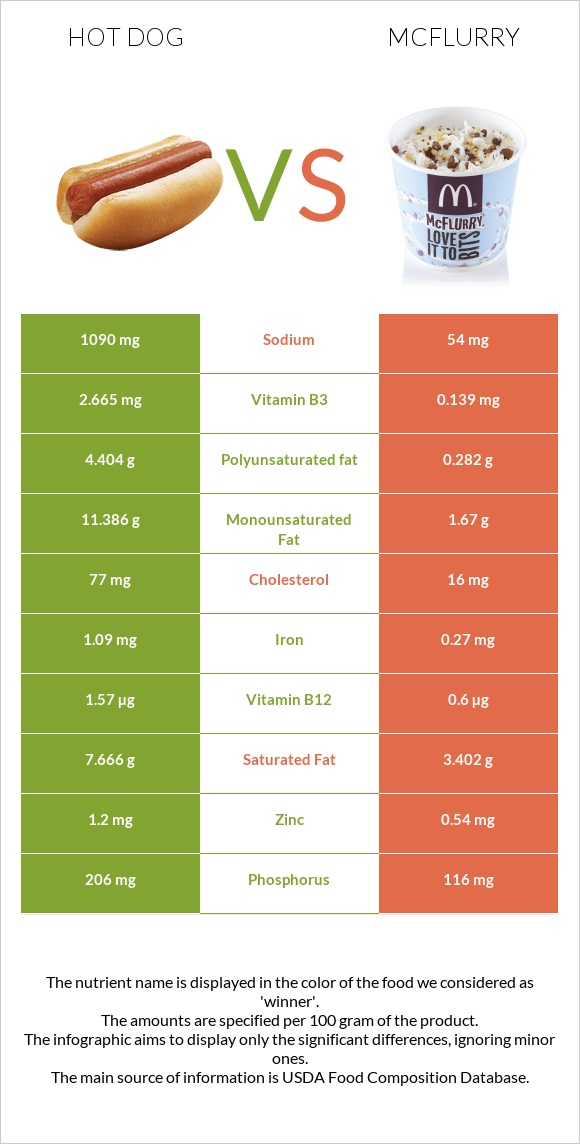
How are hot dogs and mcFlurry different? Hot dogs are richer in vitamin B12, vitamin B3, phosphorus, iron, and vitamin B6, while mcFlurry is higher in vitamin B2 and vitamin B5. Hot dogs cover your daily need for sodium, 45% more than mcFlurry. Hot dogs contain 19 times more vitamin B3 than mcFlurry. Hot dogs contain 2.665mg of vitamin B3, while mcFlurry contains 0.139mg. McFlurry is lower in sodium. Frankfurter, meat and McDONALD'S, McFLURRY with M&M'S CANDIES types were used in this article.
Infographic
Mineral Comparison
Mineral comparison score is based on the number of minerals by which one or the other food is richer. The "coverage" charts below show how much of the daily needs can be covered by 300 grams of the food.
5
100 g
300 g
1 serving (1 hot dog) - 52g
Magnesium
Magnesium
Calcium
Calcium
Potassium
Potassium
Iron
Iron
Copper
Copper
Zinc
Zinc
Phosphorus
Phosphorus
Sodium
Sodium
Manganese
Manganese
Selenium
Selenium
11%
30%
13%
41%
32%
33%
88%
142%
5.9%
68%
4
100 g
300 g
1 regular (12 fl oz) - 348g 1 large (16 fl oz) - 504g
Magnesium
Magnesium
Calcium
Calcium
Potassium
Potassium
Iron
Iron
Copper
Copper
Zinc
Zinc
Phosphorus
Phosphorus
Sodium
Sodium
Manganese
Manganese
Selenium
Selenium
12%
41%
18%
10%
15%
15%
50%
7%
6%
0%
Vitamin Comparison
Vitamin comparison score is based on the number of vitamins by which one or the other food is richer. The "coverage" charts below show how much of the daily needs can be covered by 300 grams of the food.
5
100 g
300 g
1 serving (1 hot dog) - 52g
Vitamin C
Vit. C
Vitamin D
Vit. D
Vitamin A
Vit. A
Vitamin E
Vit. E
Vitamin B1
Vit. B1
Vitamin B2
Vit. B2
Vitamin B3
Vit. B3
Vitamin B5
Vit. B5
Vitamin B6
Vit. B6
Vitamin B12
Vit. B12
Vitamin K
Vit. K
Folate
Folate
0%
0%
0%
3.8%
14%
28%
50%
19%
38%
196%
0%
4.5%
2
100 g
300 g
1 regular (12 fl oz) - 348g 1 large (16 fl oz) - 504g
Vitamin C
Vit. C
Vitamin D
Vit. D
Vitamin A
Vit. A
Vitamin E
Vit. E
Vitamin B1
Vit. B1
Vitamin B2
Vit. B2
Vitamin B3
Vit. B3
Vitamin B5
Vit. B5
Vitamin B6
Vit. B6
Vitamin B12
Vit. B12
Vitamin K
Vit. K
Folate
Folate
0%
0%
0%
1.6%
13%
56%
2.6%
44%
12%
75%
0%
2.3%
All nutrients comparison - raw data values
Nutrient
DV% diff.
Sodium
1090mg
54mg
45%
Vitamin B12
1.57µg
0.6µg
40%
Fats
25.76g
6.46g
30%
Polyunsaturated fat
4.404g
0.282g
27%
Monounsaturated fat
11.386g
1.67g
24%
Selenium
12.5µg
23%
Cholesterol
77mg
16mg
20%
Saturated fat
7.666g
3.402g
19%
Vitamin B3
2.665mg
0.139mg
16%
Phosphorus
206mg
116mg
13%
Protein
10.26g
4.02g
12%
Iron
1.09mg
0.27mg
10%
Vitamin B2
0.121mg
0.243mg
9%
Vitamin B6
0.166mg
0.053mg
9%
Carbs
4.17g
26.82g
8%
Vitamin B5
0.31mg
0.73mg
8%
Calories
290kcal
177kcal
6%
Copper
0.097mg
0.044mg
6%
Zinc
1.2mg
0.54mg
6%
Calcium
99mg
135mg
4%
Potassium
152mg
208mg
2%
Fiber
0g
0.2g
1%
Vitamin E
0.19mg
0.08mg
1%
Folate
6µg
3µg
1%
Protein per 100 calories
3.5g
2.3g
N/A
Calories per 10 g protein
283kcal
440kcal
N/A
Weight per 100 calories
34g
56g
N/A
Unsaturated / Saturated Fat ratio
2.1
0.57
N/A
Net carbs
4.17g
26.62g
N/A
Magnesium
15mg
17mg
0%
Sugar
24.37g
N/A
Manganese
0.045mg
0.046mg
0%
Vitamin B1
0.055mg
0.051mg
0%
Trans fat
0.281g
N/A
Tryptophan
0.111mg
0%
Threonine
0.474mg
0%
Isoleucine
0.53mg
0%
Leucine
0.907mg
0%
Lysine
0.963mg
0%
Methionine
0.291mg
0%
Phenylalanine
0.445mg
0%
Valine
0.555mg
0%
Histidine
0.331mg
0%
Fructose
0.21g
0%
Macronutrient Comparison
Macronutrient breakdown side-by-side comparison
3
10%
26%
4%
56%
4%
Protein:
10.26 g
Fats:
25.76 g
Carbs:
4.17 g
Water:
56.31 g
Other:
3.5 g
2
4%
6%
27%
62%
Protein:
4.02 g
Fats:
6.46 g
Carbs:
26.82 g
Water:
61.74 g
Other:
0.96 g
Contains
more
Protein Protein
+155.2%
Contains
more
Fats Fats
+298.8%
Contains
more
Other Other
+264.6%
Contains
more
Carbs Carbs
+543.2%
Fat Type Comparison
Fat type breakdown side-by-side comparison
2
33%
49%
19%
Saturated fat:
Sat. Fat
7.666 g
Monounsaturated fat:
Mono. Fat
11.386 g
Polyunsaturated fat:
Poly. Fat
4.404 g
1
64%
31%
5%
Saturated fat:
Sat. Fat
3.402 g
Monounsaturated fat:
Mono. Fat
1.67 g
Polyunsaturated fat:
Poly. Fat
0.282 g
Contains
more
Mono. Fat Monounsaturated fat
+581.8%
Contains
more
Poly. Fat Polyunsaturated fat
+1461.7%
Contains
less
Sat. Fat Saturated fat
-55.6%