How are lablab and mung beans different? Mung beans are higher than lablab in folate, copper, phosphorus, vitamin B5, vitamin B1, iron, potassium, vitamin B6, magnesium, and manganese. Mung beans cover your daily need for folate, 155% more than lablab. Lablab has a higher glycemic index (45) than mung beans (31). Hyacinth beans, mature seeds, cooked, boiled, without salt and Mung beans, mature seeds, raw types were used in this article.
Infographic
Mineral Comparison
Mineral comparison score is based on the number of minerals by which one or the other food is richer. The "coverage" charts below show how much of the daily needs can be covered by 300 grams of the food.
1
100 g
300 g
1 cup - 194g
Magnesium
Magnesium
Calcium
Calcium
Potassium
Potassium
Iron
Iron
Copper
Copper
Zinc
Zinc
Phosphorus
Phosphorus
Sodium
Sodium
Manganese
Manganese
Selenium
Selenium
59%
12%
30%
172%
114%
78%
51%
0.91%
63%
15%
8
100 g
300 g
1 tbsp - 13g 1 cup - 207g
Magnesium
Magnesium
Calcium
Calcium
Potassium
Potassium
Iron
Iron
Copper
Copper
Zinc
Zinc
Phosphorus
Phosphorus
Sodium
Sodium
Manganese
Manganese
Selenium
Selenium
135%
40%
110%
253%
314%
73%
157%
2%
135%
45%
Vitamin Comparison
Vitamin comparison score is based on the number of vitamins by which one or the other food is richer. The "coverage" charts below show how much of the daily needs can be covered by 300 grams of the food.
0
100 g
300 g
1 cup - 194g
Vitamin C
Vit. C
Vitamin D
Vit. D
Vitamin A
Vit. A
Vitamin E
Vit. E
Vitamin B1
Vit. B1
Vitamin B2
Vit. B2
Vitamin B3
Vit. B3
Vitamin B5
Vit. B5
Vitamin B6
Vit. B6
Vitamin B12
Vit. B12
Vitamin K
Vit. K
Folate
Folate
0%
0%
0%
0%
68%
8.5%
7.7%
19%
8.5%
0%
0%
3%
10
100 g
300 g
1 tbsp - 13g 1 cup - 207g
Vitamin C
Vit. C
Vitamin D
Vit. D
Vitamin A
Vit. A
Vitamin E
Vit. E
Vitamin B1
Vit. B1
Vitamin B2
Vit. B2
Vitamin B3
Vit. B3
Vitamin B5
Vit. B5
Vitamin B6
Vit. B6
Vitamin B12
Vit. B12
Vitamin K
Vit. K
Folate
Folate
16%
0%
2%
10%
155%
54%
42%
115%
88%
0%
23%
469%
All nutrients comparison - raw data values
Nutrient
DV% diff.
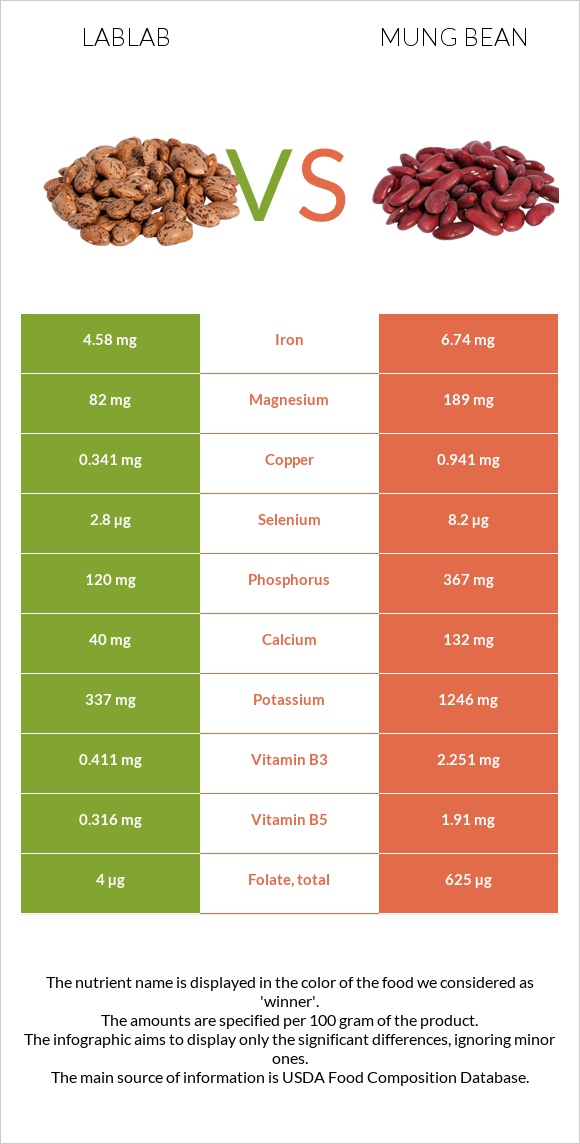
Folate
4µg
625µg
155%
Copper
0.341mg
0.941mg
67%
Fiber
16.3g
65%
Phosphorus
120mg
367mg
35%
Vitamin B5
0.316mg
1.91mg
32%
Protein
8.14g
23.86g
31%
Vitamin B1
0.27mg
0.621mg
29%
Potassium
337mg
1246mg
27%
Iron
4.58mg
6.74mg
27%
Vitamin B6
0.037mg
0.382mg
27%
Magnesium
82mg
189mg
25%
Manganese
0.482mg
1.035mg
24%
Choline
97.9mg
18%
Vitamin B2
0.037mg
0.233mg
15%
Carbs
20.69g
62.62g
14%
Calories
117kcal
347kcal
12%
Vitamin B3
0.411mg
2.251mg
12%
Selenium
2.8µg
8.2µg
10%
Calcium
40mg
132mg
9%
Vitamin K
9µg
8%
Vitamin C
0mg
4.8mg
5%
Vitamin E
0.51mg
3%
Zinc
2.85mg
2.68mg
2%
Fats
0.58g
1.15g
1%
Vitamin A
0µg
6µg
1%
Saturated fat
0.099g
0.348g
1%
Polyunsaturated fat
0.245g
0.384g
1%
Protein per 100 calories
7g
6.9g
N/A
Calories per 10 g protein
144kcal
145kcal
N/A
Weight per 100 calories
85g
29g
N/A
Net carbs
20.69g
46.32g
N/A
Sugar
6.6g
N/A
Sodium
7mg
15mg
0%
Monounsaturated fat
0.026g
0.161g
0%
Tryptophan
0.068mg
0.26mg
0%
Threonine
0.315mg
0.782mg
0%
Isoleucine
0.39mg
1.008mg
0%
Leucine
0.691mg
1.847mg
0%
Lysine
0.556mg
1.664mg
0%
Methionine
0.065mg
0.286mg
0%
Phenylalanine
0.41mg
1.443mg
0%
Valine
0.422mg
1.237mg
0%
Histidine
0.233mg
0.695mg
0%
Macronutrient Comparison
Macronutrient breakdown side-by-side comparison
1
8%
21%
69%
Protein:
8.14 g
Fats:
0.58 g
Carbs:
20.69 g
Water:
69.13 g
Other:
1.46 g
4
24%
63%
9%
3%
Protein:
23.86 g
Fats:
1.15 g
Carbs:
62.62 g
Water:
9.05 g
Other:
3.32 g
Contains
more
Water Water
+663.9%
Contains
more
Protein Protein
+193.1%
Contains
more
Fats Fats
+98.3%
Contains
more
Carbs Carbs
+202.7%
Contains
more
Other Other
+127.4%
Fat Type Comparison
Fat type breakdown side-by-side comparison
1
27%
7%
66%
Saturated fat:
Sat. Fat
0.099 g
Monounsaturated fat:
Mono. Fat
0.026 g
Polyunsaturated fat:
Poly. Fat
0.245 g
2
39%
18%
43%
Saturated fat:
Sat. Fat
0.348 g
Monounsaturated fat:
Mono. Fat
0.161 g
Polyunsaturated fat:
Poly. Fat
0.384 g
Contains
less
Sat. Fat Saturated fat
-71.6%
Contains
more
Mono. Fat Monounsaturated fat
+519.2%
Contains
more
Poly. Fat Polyunsaturated fat
+56.7%