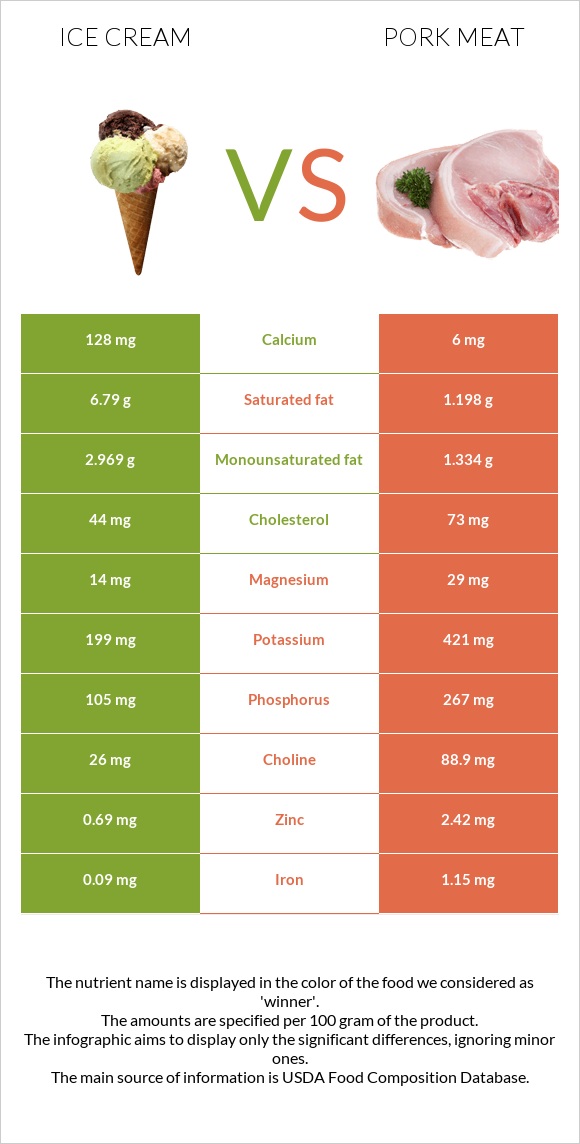
What are the main differences between ice cream and pork Meat? Ice cream is richer in calcium, yet pork Meat is richer in vitamin B1, selenium, vitamin B6, vitamin B3, phosphorus, zinc, iron, and choline. Pork Meat's daily need coverage for vitamin B1 is 76% higher. Ice cream has 21 times more calcium than pork Meat. Ice cream has 128mg of calcium, while pork Meat has 6mg. Pork Meat contains less saturated fat. Pork Meat has a lower glycemic index than ice cream. We used Ice creams, vanilla and Pork, fresh, loin, tenderloin, separable lean only, cooked, roasted types in this comparison.
Infographic
Mineral Comparison
Mineral comparison score is based on the number of minerals by which one or the other food is richer. The "coverage" charts below show how much of the daily needs can be covered by 300 grams of the food.
1
100 g
300 g
1 serving 1/2 cup - 66g
Magnesium
Magnesium
Calcium
Calcium
Potassium
Potassium
Iron
Iron
Copper
Copper
Zinc
Zinc
Phosphorus
Phosphorus
Sodium
Sodium
Manganese
Manganese
Selenium
Selenium
10%
38%
18%
3.4%
7.7%
19%
45%
10%
1%
9.8%
9
100 g
300 g
3 oz - 85g 1 piece, cooked, excluding refuse (yield from 1 lb raw meat with refuse) - 333g 1 roast - 402g
Magnesium
Magnesium
Calcium
Calcium
Potassium
Potassium
Iron
Iron
Copper
Copper
Zinc
Zinc
Phosphorus
Phosphorus
Sodium
Sodium
Manganese
Manganese
Selenium
Selenium
21%
1.8%
37%
43%
37%
66%
114%
7.4%
1.7%
208%
Vitamin Comparison
Vitamin comparison score is based on the number of vitamins by which one or the other food is richer. The "coverage" charts below show how much of the daily needs can be covered by 300 grams of the food.
5
100 g
300 g
1 serving 1/2 cup - 66g
Vitamin C
Vit. C
Vitamin D
Vit. D
Vitamin A
Vit. A
Vitamin E
Vit. E
Vitamin B1
Vit. B1
Vitamin B2
Vit. B2
Vitamin B3
Vit. B3
Vitamin B5
Vit. B5
Vitamin B6
Vit. B6
Vitamin B12
Vit. B12
Vitamin K
Vit. K
Folate
Folate
2%
3%
39%
6%
10%
55%
2.2%
35%
11%
49%
0.75%
3.8%
6
100 g
300 g
3 oz - 85g 1 piece, cooked, excluding refuse (yield from 1 lb raw meat with refuse) - 333g 1 roast - 402g
Vitamin C
Vit. C
Vitamin D
Vit. D
Vitamin A
Vit. A
Vitamin E
Vit. E
Vitamin B1
Vit. B1
Vitamin B2
Vit. B2
Vitamin B3
Vit. B3
Vitamin B5
Vit. B5
Vitamin B6
Vit. B6
Vitamin B12
Vit. B12
Vitamin K
Vit. K
Folate
Folate
0%
3%
0%
1.6%
238%
89%
139%
61%
171%
71%
0%
0%
All nutrients comparison - raw data values
Nutrient
DV% diff.
Vitamin B1
0.041mg
0.95mg
76%
Selenium
1.8µg
38.2µg
66%
Vitamin B6
0.048mg
0.739mg
53%
Vitamin B3
0.116mg
7.432mg
46%
Protein
3.5g
26.17g
45%
Saturated fat
6.79g
1.198g
25%
Phosphorus
105mg
267mg
23%
Zinc
0.69mg
2.42mg
16%
Iron
0.09mg
1.15mg
13%
Vitamin A
118µg
0µg
13%
Fats
11g
3.51g
12%
Calcium
128mg
6mg
12%
Vitamin B2
0.24mg
0.387mg
11%
Choline
26mg
88.9mg
11%
Cholesterol
44mg
73mg
10%
Copper
0.023mg
0.111mg
10%
Vitamin B5
0.581mg
1.012mg
9%
Carbs
23.6g
0g
8%
Vitamin B12
0.39µg
0.57µg
8%
Potassium
199mg
421mg
7%
Magnesium
14mg
29mg
4%
Monounsaturated fat
2.969g
1.334g
4%
Calories
207kcal
143kcal
3%
Fiber
0.7g
0g
3%
Vitamin C
0.6mg
0mg
1%
Sodium
80mg
57mg
1%
Vitamin E
0.3mg
0.08mg
1%
Folate
5µg
0µg
1%
Protein per 100 calories
1.7g
18g
N/A
Calories per 10 g protein
591kcal
55kcal
N/A
Weight per 100 calories
48g
70g
N/A
Unsaturated / Saturated Fat ratio
0.5
1.5
N/A
Net carbs
22.9g
0g
N/A
Vitamin D*
8 IU
10 IU
0%
Vitamin D
0.2µg
0.2µg
0%
Sugar
21.22g
0g
N/A
Manganese
0.008mg
0.013mg
0%
Vitamin K
0.3µg
0µg
0%
Trans fat
0.033g
N/A
Polyunsaturated fat
0.452g
0.506g
0%
Tryptophan
0.045mg
0.275mg
0%
Threonine
0.146mg
1.175mg
0%
Isoleucine
0.195mg
1.288mg
0%
Leucine
0.316mg
2.229mg
0%
Lysine
0.258mg
2.427mg
0%
Methionine
0.081mg
0.721mg
0%
Phenylalanine
0.157mg
1.1mg
0%
Valine
0.217mg
1.367mg
0%
Histidine
0.088mg
1.13mg
0%
Omega-3 - EPA
0.003g
0g
N/A
Omega-3 - ALA
0.013g
N/A
Omega-6 - Eicosadienoic acid
0.013g
N/A
Omega-6 - Linoleic acid
0.411g
N/A
Macronutrient Comparison
Macronutrient breakdown side-by-side comparison
3
4%
11%
24%
61%
Protein:
3.5 g
Fats:
11 g
Carbs:
23.6 g
Water:
61 g
Other:
0.9 g
2
26%
4%
69%
Protein:
26.17 g
Fats:
3.51 g
Carbs:
0 g
Water:
69.45 g
Other:
0.87 g
Contains
more
Fats Fats
+213.4%
Contains
more
Carbs Carbs
+∞%
Contains
more
Protein Protein
+647.7%
Contains
more
Water Water
+13.9%
Fat Type Comparison
Fat type breakdown side-by-side comparison
1
66%
29%
4%
Saturated fat:
Sat. Fat
6.79 g
Monounsaturated fat:
Mono. Fat
2.969 g
Polyunsaturated fat:
Poly. Fat
0.452 g
2
39%
44%
17%
Saturated fat:
Sat. Fat
1.198 g
Monounsaturated fat:
Mono. Fat
1.334 g
Polyunsaturated fat:
Poly. Fat
0.506 g
Contains
more
Mono. Fat Monounsaturated fat
+122.6%
Contains
less
Sat. Fat Saturated fat
-82.4%
Contains
more
Poly. Fat Polyunsaturated fat
+11.9%