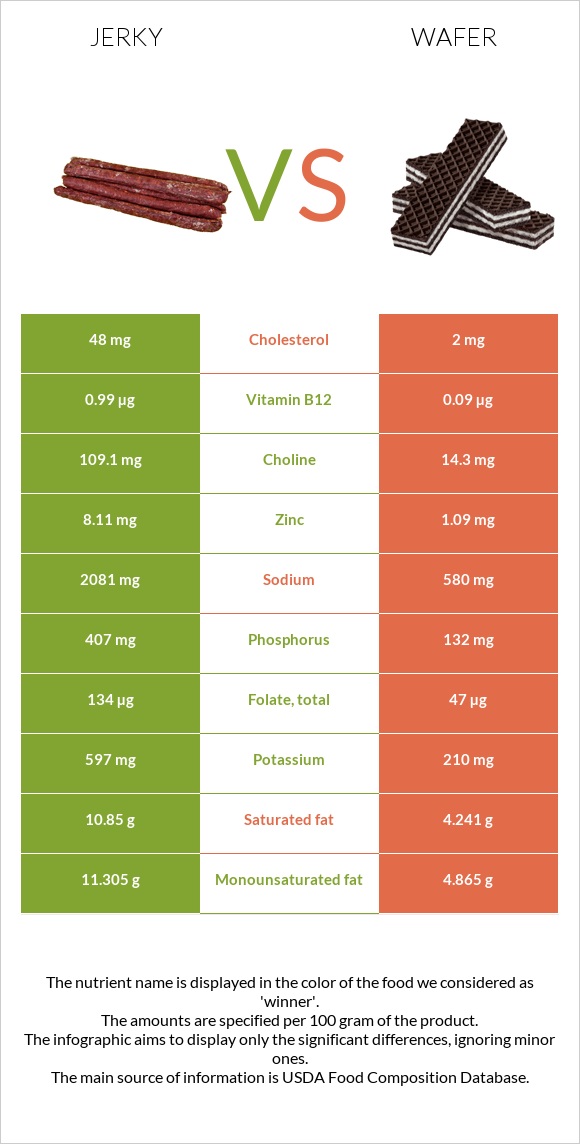
How are jerky and wafer different? Jerky is higher in zinc, phosphorus, vitamin B12, folate, iron, and choline; however, wafer is richer in copper and manganese. Daily need coverage for sodium for jerky is 65% higher. Jerky contains 11 times more vitamin B12 than wafer. While jerky contains 0.99µg of vitamin B12, wafer contains only 0.09µg. Wafer has less sodium. Jerky has a lower glycemic index (0) than wafer (61). Snacks, beef jerky, chopped, and formed and Cookies, chocolate wafers are the varieties used in this article.
Infographic
Mineral Comparison
Mineral comparison score is based on the number of minerals by which one or the other food is richer. The "coverage" charts below show how much of the daily needs can be covered by 300 grams of the food.
5
100 g
300 g
1 piece, large - 20g 1 oz - 28.35g 1 oz - 28.35g
Magnesium
Magnesium
Calcium
Calcium
Potassium
Potassium
Iron
Iron
Copper
Copper
Zinc
Zinc
Phosphorus
Phosphorus
Sodium
Sodium
Manganese
Manganese
Selenium
Selenium
36%
6%
53%
203%
76%
221%
174%
271%
14%
58%
4
100 g
300 g
1 wafer - 6g 1 oz - 28.35g 1 cup, crumbs - 112g
Magnesium
Magnesium
Calcium
Calcium
Potassium
Potassium
Iron
Iron
Copper
Copper
Zinc
Zinc
Phosphorus
Phosphorus
Sodium
Sodium
Manganese
Manganese
Selenium
Selenium
38%
9.3%
19%
150%
154%
30%
57%
76%
91%
31%
Vitamin Comparison
Vitamin comparison score is based on the number of vitamins by which one or the other food is richer. The "coverage" charts below show how much of the daily needs can be covered by 300 grams of the food.
4
100 g
300 g
1 piece, large - 20g 1 oz - 28.35g 1 oz - 28.35g
Vitamin C
Vit. C
Vitamin D
Vit. D
Vitamin A
Vit. A
Vitamin E
Vit. E
Vitamin B1
Vit. B1
Vitamin B2
Vit. B2
Vitamin B3
Vit. B3
Vitamin B5
Vit. B5
Vitamin B6
Vit. B6
Vitamin B12
Vit. B12
Vitamin K
Vit. K
Folate
Folate
0%
4.5%
0%
9.8%
39%
33%
32%
9.8%
41%
124%
5.8%
101%
6
100 g
300 g
1 wafer - 6g 1 oz - 28.35g 1 cup, crumbs - 112g
Vitamin C
Vit. C
Vitamin D
Vit. D
Vitamin A
Vit. A
Vitamin E
Vit. E
Vitamin B1
Vit. B1
Vitamin B2
Vit. B2
Vitamin B3
Vit. B3
Vitamin B5
Vit. B5
Vitamin B6
Vit. B6
Vitamin B12
Vit. B12
Vitamin K
Vit. K
Folate
Folate
0%
0%
1%
14%
51%
61%
54%
23%
12%
11%
6%
35%
All nutrients comparison - raw data values
Nutrient
DV% diff.
Sodium
2081mg
580mg
65%
Zinc
8.11mg
1.09mg
64%
Protein
33.2g
6.6g
53%
Phosphorus
407mg
132mg
39%
Vitamin B12
0.99µg
0.09µg
38%
Saturated fat
10.85g
4.241g
30%
Copper
0.227mg
0.463mg
26%
Manganese
0.111mg
0.696mg
25%
Folate
134µg
47µg
22%
Carbs
11g
72.7g
21%
Polyunsaturated fat
1.011g
4.153g
21%
Fats
25.6g
14.2g
18%
Iron
5.42mg
4.01mg
18%
Choline
109.1mg
14.3mg
17%
Monounsaturated fat
11.305g
4.865g
16%
Cholesterol
48mg
2mg
15%
Potassium
597mg
210mg
11%
Vitamin B2
0.142mg
0.266mg
10%
Vitamin B6
0.179mg
0.051mg
10%
Selenium
10.7µg
5.7µg
9%
Vitamin B3
1.732mg
2.858mg
7%
Fiber
1.8g
3.4g
6%
Vitamin B1
0.154mg
0.203mg
4%
Vitamin B5
0.163mg
0.381mg
4%
Caffeine
0mg
10mg
3%
Vitamin D
0.3µg
0µg
2%
Vitamin E
0.49mg
0.72mg
2%
Calories
410kcal
433kcal
1%
Vitamin D*
11 IU
0 IU
1%
Calcium
20mg
31mg
1%
Protein per 100 calories
8.1g
1.5g
N/A
Calories per 10 g protein
123kcal
656kcal
N/A
Weight per 100 calories
24g
23g
N/A
Unsaturated / Saturated Fat ratio
1.1
2.1
N/A
Net carbs
9.2g
69.3g
N/A
Magnesium
51mg
53mg
0%
Sugar
9g
37.43g
N/A
Vitamin A
0µg
3µg
0%
Vitamin K
2.3µg
2.4µg
0%
Tryptophan
0.096mg
0%
Threonine
0.22mg
0%
Isoleucine
0.261mg
0%
Leucine
0.447mg
0%
Lysine
0.281mg
0%
Methionine
0.105mg
0%
Phenylalanine
0.308mg
0%
Valine
0.323mg
0%
Histidine
0.128mg
0%
Omega-3 - EPA
0g
0.003g
N/A
Omega-3 - DHA
0g
0.002g
N/A
Macronutrient Comparison
Macronutrient breakdown side-by-side comparison
4
33%
26%
11%
23%
7%
Protein:
33.2 g
Fats:
25.6 g
Carbs:
11 g
Water:
23.36 g
Other:
6.84 g
1
7%
14%
73%
5%
2%
Protein:
6.6 g
Fats:
14.2 g
Carbs:
72.7 g
Water:
4.5 g
Other:
2 g
Contains
more
Protein Protein
+403%
Contains
more
Fats Fats
+80.3%
Contains
more
Water Water
+419.1%
Contains
more
Other Other
+242%
Contains
more
Carbs Carbs
+560.9%
Fat Type Comparison
Fat type breakdown side-by-side comparison
1
47%
49%
4%
Saturated fat:
Sat. Fat
10.85 g
Monounsaturated fat:
Mono. Fat
11.305 g
Polyunsaturated fat:
Poly. Fat
1.011 g
2
32%
37%
31%
Saturated fat:
Sat. Fat
4.241 g
Monounsaturated fat:
Mono. Fat
4.865 g
Polyunsaturated fat:
Poly. Fat
4.153 g
Contains
more
Mono. Fat Monounsaturated fat
+132.4%
Contains
less
Sat. Fat Saturated fat
-60.9%
Contains
more
Poly. Fat Polyunsaturated fat
+310.8%