Kit Kat vs. Twix — Health Impact and Nutrition Comparison


Summary
Kitkat has a smaller portion size compared to Twix. KitKat is lower in carbs, fat, and calories. KitKat is richer in copper, phosphorus, and vitamins B5 and B12. Twix contains a cookie and a caramel that is dipped in chocolate. KitKat contains wafers and chocolate layers dipped in chocolate.
Introduction
Kitkat and Twix are two types of famous chocolate bars worldwide, but what's the difference between them?
There is a big taste and flavor difference, and in addition, there is a nutritional aspect difference.
General differences
We’ve all had Kitkat and Twix bars before. The taste and flavors can be felt even just by imagining them.
Kitkat is a chocolate that contains wafers and chocolate filling inside and is coated with milk chocolate from the outside. Different versions of KitKats include dark chocolate, peanut butter, and strawberry white chocolate.
Twix chocolate is different from KitKat; it contains a crispy cookie, a luscious caramel, and is covered with smooth chocolate.
You can also read about Mars vs. Snickers in this article.
Nutritional content comparison
The logical comparison here would be between a regular-sized bar of each.
For KitKat, the portion size is 1.5oz, equivalent to 42g. In comparison, the portion size of Twix is 58g.
Calories
Kitkat contains 218 calories, and Twix contains 291 calories per portion size.
Carbs
Twix is higher in carbs since it has a dense caramel layer and a cookie inside.
Twix contains 38g of carbs; in comparison, KitKat includes 27g of carbs.
Fats
KitKat is lower in fats compared to Twix.
Twix contains 14.4g of fat. In comparison, KitKat contains 11g of fats.
Proteins
They have similar amounts of proteins. About 2.8g for each.
Below we can visualize the macronutrients of each. However, they are displayed in 100g for each since it's the standard way for comparing them.
Macronutrient Comparison
Contains
more
ProteinProtein
+32.6%
Contains
more
WaterWater
+159.5%
Minerals and vitamins
According to their portion sizes, the mineral and vitamin profiles are not very remarkable based on daily values. However, if we compare 100g of each, KitKat is richer in copper, phosphorus, and vitamins B5 and B12.
Below we can visualize their distribution.
Mineral Comparison
Contains
more
MagnesiumMagnesium
+37%
Contains
more
CalciumCalcium
+17.9%
Contains
more
PotassiumPotassium
+24.2%
Contains
more
IronIron
+23.5%
Contains
more
CopperCopper
+11.7%
Contains
more
PhosphorusPhosphorus
+28.6%
Contains
less
SodiumSodium
-72.7%
Contains
more
SeleniumSelenium
+16.3%
Contains
more
ZincZinc
+1077.8%
Contains
more
ManganeseManganese
+173%
Vitamin Comparison
Contains
more
Vitamin AVitamin A
+20%
Contains
more
Vitamin B5Vitamin B5
+141.5%
Contains
more
Vitamin B12Vitamin B12
+69.7%
Contains
more
Vitamin CVitamin C
+∞%
Contains
more
Vitamin EVitamin E
+117.6%
Contains
more
Vitamin B1Vitamin B1
+32.5%
Contains
more
Vitamin B3Vitamin B3
+121.8%
Contains
more
Vitamin B6Vitamin B6
+25%
Contains
more
FolateFolate
+85.7%

Infographic
All nutrients comparison - raw data values
| Nutrient | |
|
DV% diff. |
| Vitamin B12 | 0.56µg | 0.33µg | 10% |
| Zinc | 0.09mg | 1.06mg | 9% |
| Manganese | 0.1mg | 0.273mg | 8% |
| Vitamin B5 | 0.64mg | 0.265mg | 8% |
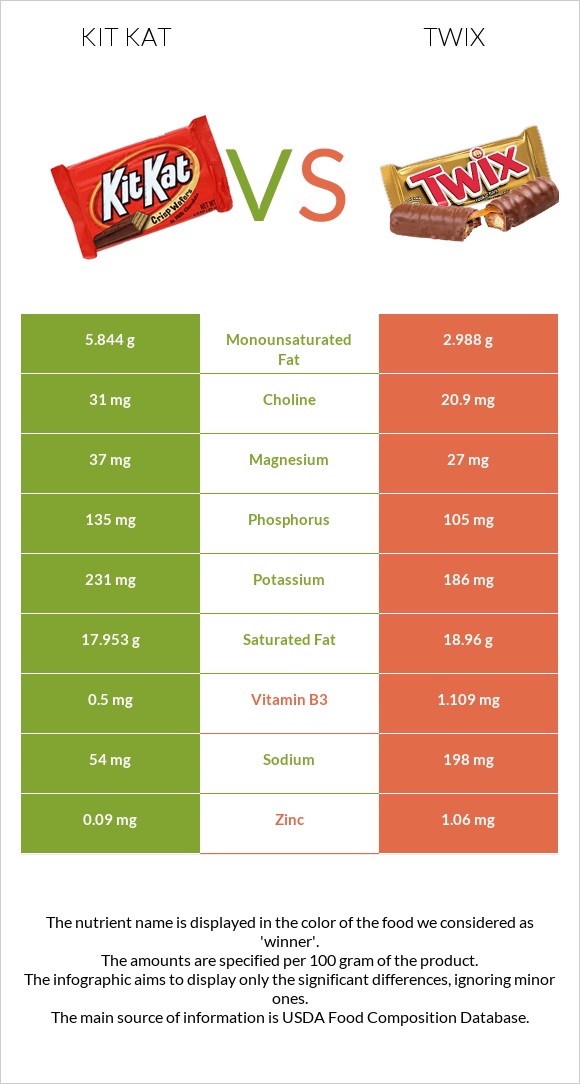
| Monounsaturated fat | 5.844g | 2.988g | 7% |
| Sodium | 54mg | 198mg | 6% |
| Saturated fat | 17.953g | 18.96g | 5% |
| Starch | 10.6g | 4% | |
| Phosphorus | 135mg | 105mg | 4% |
| Vitamin B3 | 0.5mg | 1.109mg | 4% |
| Protein | 6.51g | 4.91g | 3% |
| Copper | 0.22mg | 0.197mg | 3% |
| Vitamin E | 0.34mg | 0.74mg | 3% |
| Vitamin B1 | 0.117mg | 0.155mg | 3% |
| Folate | 14µg | 26µg | 3% |
| Fats | 25.99g | 24.85g | 2% |
| Magnesium | 37mg | 27mg | 2% |
| Calcium | 125mg | 106mg | 2% |
| Iron | 1mg | 0.81mg | 2% |
| Choline | 31mg | 20.9mg | 2% |
| Polyunsaturated fat | 0.895g | 0.628g | 2% |
| Caffeine | 14mg | 7mg | 2% |
| Calories | 518kcal | 502kcal | 1% |
| Vitamin C | 0mg | 0.6mg | 1% |
| Cholesterol | 11mg | 7mg | 1% |
| Potassium | 231mg | 186mg | 1% |
| Selenium | 5µg | 4.3µg | 1% |
| Protein per 100 calories | 1.3g | 0.98g | N/A |
| Calories per 10 g protein | 796kcal | 1022kcal | N/A |
| Weight per 100 calories | 19g | 20g | N/A |
| Unsaturated / Saturated Fat ratio | 0.38 | 0.19 | N/A |
| Net carbs | 63.59g | 63.7g | N/A |
| Carbs | 64.59g | 64.8g | 0% |
| Sugar | 48.68g | 48.25g | N/A |
| Fiber | 1g | 1.1g | 0% |
| Vitamin A | 24µg | 20µg | 0% |
| Vitamin B2 | 0.21mg | 0.208mg | 0% |
| Vitamin B6 | 0.02mg | 0.025mg | 0% |
| Vitamin K | 5.2µg | 5.6µg | 0% |
| Trans fat | 0.099g | 0.342g | N/A |
| Tryptophan | 0.09mg | 0% | |
| Threonine | 0.19mg | 0% | |
| Isoleucine | 0.28mg | 0% | |
| Leucine | 0.52mg | 0% | |
| Lysine | 0.28mg | 0% | |
| Methionine | 0.16mg | 0% | |
| Phenylalanine | 0.27mg | 0% | |
| Valine | 0.36mg | 0% | |
| Histidine | 0.11mg | 0% | |
| Fructose | 0.2g | 0% | |
| Omega-3 - ALA | 0.075g | N/A |
Fat Type Comparison
| Contains more Mono. FatMonounsaturated fat | +95.6% |
| Contains more Poly. FatPolyunsaturated fat | +42.5% |
People also compare


References
All the values for which the sources are not specified explicitly are taken from FDA’s Food Central. The exact link to the food presented on this page can be found below.
- Kit Kat - https://fdc.nal.usda.gov/fdc-app.html#/food-details/167992/nutrients
- Twix - https://fdc.nal.usda.gov/fdc-app.html#/food-details/168768/nutrients
All the Daily Values are presented for males aged 31-50, for 2000-calorie diets.