Mars vs. Snickers — Health Impact and Nutrition Comparison


Summary
Mars bar is higher in carbs, calories and has a higher glycemic index. On the other hand, snickers are richer in proteins and higher in fats. Their vitamin and mineral profiles are poor. Consumption should be minimal because of their increased risks for different health disorders.
Table of contents
Introduction
Mars and Snickers are chocolate candy bars that are widely known around the world. However, in the United States, mars bars are marketed in a milky way that comes in brown packaging. A global version of the milky way comes in a blue wrap; however, the two Milky Ways are not similar. Mars bars are marketed as the milky way in the US that comes in a brown wrap.
Snickers, on the other hand, are widely known all over the world to be the same. It has many versions that are available worldwide.
In this article, we will discuss the difference between Mars bars and Snickers bars according to their nutritional content, health impacts, diets and weight loss, and variations.
What are the actual differences?
There are many differences which are regional availability, price, taste, and flavor.
Regional availability
Mars bars are available worldwide except in the US. However, the milky way in the US is the same as the Mars bar.
Snickers, on the other hand, are available worldwide, and their popularity is known everywhere. So, these bars are available in different regions.
Price
Mars bars and Snickers have similar prices. However, as varieties of each exist, the prices might be different between those.
Taste and flavor
Although both have a lot of similar ingredients, the main difference between a Mars bar is that it is made of a layer of nougat and caramel and all over coated with milk chocolate.
In comparison, the main difference in Snickers is the extra peanuts added to the nougat, caramel, and milk chocolate layer and a more solid texture.
Nutritional content
The following sections will be discussed according to 100g of each. However, 1 bar of Mars weighs 58g, and 1 bar of Snickers weighs around 53g.
Calories
Mars bars and Snickers have similar amounts of calories.
However, when comparing each bar, Mars has lower calories than Snickers. Mars bar has 475 calories per 100g, while Snickers has 13 calories more.
Glycemic index
Mars bar has a higher glycemic index than Snickers. Mars bar has a glycemic index of 62, whereas Snickers has a glycemic index of 51.
Macronutrients
You can see in the chart below that both bars consist of carbohydrates generally. Mars is higher in carbs than Snickers. On the other hand, Snickers is richer in fats and proteins. You can read more detailed information in the sections below.
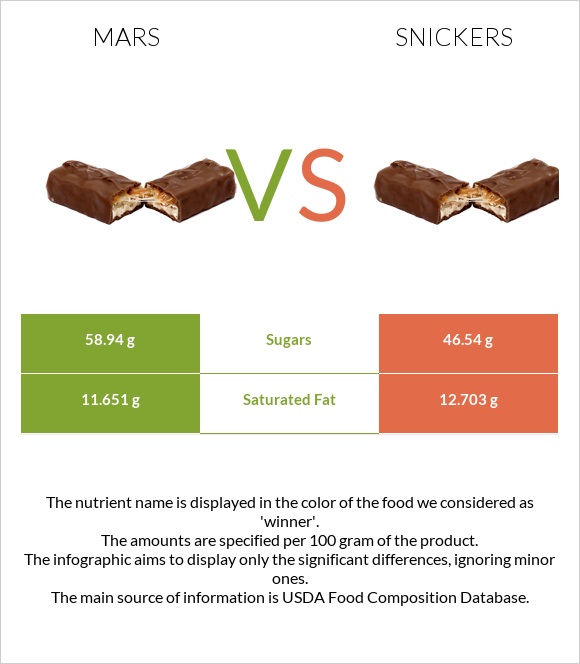
Mars bars and Snickers are mostly made of macronutrients, mainly focused on refined sugars and saturated fats.
Macronutrient Comparison
Contains
more
CarbsCarbs
+15.2%
Contains
more
OtherOther
+59.7%
Contains
more
ProteinProtein
+60.3%
Contains
more
FatsFats
+26.2%
Contains
more
WaterWater
+162.9%
Carbs
Mars contains higher amounts of carbs than Snickers. It contains 10g more carbs.
It is important to note that they both contain very high amounts of carbs, which should be a matter of consideration while eating. In addition to that, the source of carbs is nearly totally from refined sugars.
Protein
Snickers contain higher amounts of protein than Mars, mostly from milk and egg, which is from the nougat and chocolate.
Fat
Snickers contain higher amounts of fat than Mars. The fat content of both is nearly 99% from saturated fat sources.
Cholesterol
Both bars contain very low amounts of cholesterol. However, Mars is higher in cholesterol than Snickers.
Fat Type Comparison
Minerals
They don't have rich and versatile mineral profiles; however, they contain significant amounts of calcium equal for both. In addition to that, they contain iron and sodium. Mars is richer in iron, whereas Snickers have higher amounts of sodium.
We can see the difference in their mineral charts in the following diagram.
Mineral Comparison
Contains
more
IronIron
+26.5%
Contains
less
SodiumSodium
-28%
Vitamins
Their vitamin profiles are very poor. Small amounts of vitamin A are present; however, they are not of much significance.
We can see the difference in their vitamin charts in the following diagram.
Vitamin Comparison
Varieties
In the case of Mars bars, there are different varieties. These are what are available in the market. Some may be discontinued in certain regions.
- Almond bars
- Midnight
- Lite
- Bisc &
- Gold
- Triple chocolate
- Mix
- Lava
- Maple
- Planets
- Dark and light
- Rocks
- Miniatures
- 100% caramel
- Honeycomb
- Delight
- XXX
- Frozen dessert bar
- Midnight ice cream bars
- Mini eggs
- World cup
- Red
- Fling
- Vanilla
- Chill
- Loaded
In the case of snickers, there are also many varieties, for example:
- Original
- Almond
- Brownie
- Protein bar
- White
- Creamy peanut butter
- Crisp
- Hazelnut
- Crisp duo
- Peanut butter
- Minis
- Bites
- Mix
- Duo bar
- Candy tree
- Yard
As we can see from the list, there are different varieties for each; there are ice cream versions that also have varieties. Protein bars are available for each, which have a different macronutrient profile and are more expensive.
There are deep-fried versions of Mars and Snickers. A breading over the bar is done before frying. This is highly filled with refined sugars, fats, and trans fats.
Weight loss and diets
Mars bars and Snickers are mostly composed of high amounts of refined sugars and saturated fats; thus, they are not an option to be part of a diet during a weight loss program. It can be called "unnecessary calories"; thus, it is better to avoid them. However, some days when you are extra tired and nothing is accessible as quickly as a Snickers or Mars bar, they serve as a great energy booster and help maintain sugar levels in case of hypoglycemia.
Keto
Mars and Snickers bars are forbidden to be consumed on a keto diet. They are packed with refined sugars and have very high carb levels. Thus avoid it at all costs.
Vegan
Mars and Snickers contain milk and egg products; thus, they should be avoided during the vegan diet. However, they are considered vegetarian. It is important to take into consideration their high amounts of sugars and fats.
Health impacts
Cardiovascular health
When comparing Mars and Snickers bars in terms of cardiovascular health, both are similar in terms of their nutritional profiles. They are both high in sugar, saturated fat, and calories, which are not favorable for cardiovascular health when consumed in excess (1).
If consumed regularly, the saturated fat content in these bars can raise LDL (“bad” cholesterol) levels in the blood, which is associated with an increased risk of atherosclerosis.
In terms of specific differences, Snickers bars contain peanuts and caramel, which may provide a slightly higher amount of protein and fiber compared to Mars bars. However, these nutritional differences are minimal and do not significantly impact their overall cardiovascular health.
For a heart-healthy diet, it's best to limit the consumption of candy bars like Mars and Snickers and opt for healthier snacks such as fresh fruit, nuts, or yogurt. If you're craving something sweet, consider indulging in a small portion of dark chocolate, which contains antioxidants and may have some heart-healthy benefits when consumed in moderation.
Diabetes
Diabetes and metabolic disorders are some of the main reasons for high mortality among populations. High caloric intake, high amounts of saturated fats, and refined sugars are the main reasons to increase risks of developing type 2 diabetes and metabolic syndrome (2). Mars bar and Snickers bar fit the category of high saturated fat and high sugar foods.
Cancer
Mars and Snickers contain high amounts of sugars which are directly indicative of increased risks of cancer. The increased risk of cancer development is between 23% and 200%, which is highly significant (3).
Guidelines
Overall, guidelines indicate that to maintain good cardiovascular health regarding diet restrictions and control, there has to be a reduction of saturated fat and reduced intake of refined sugars. The saturated fat intake shouldn't surpass 10% of the total caloric intake (4).
References

Infographic
All nutrients comparison - raw data values
| Nutrient | |
|
DV% diff. |
| Fats | 19.32g | 24.38g | 8% |
| Protein | 4.28g | 6.86g | 5% |
| Saturated fat | 11.651g | 12.703g | 5% |
| Carbs | 72.4g | 62.85g | 3% |
| Iron | 0.86mg | 0.68mg | 2% |
| Sodium | 136mg | 189mg | 2% |
| Calories | 475kcal | 488kcal | 1% |
| Cholesterol | 12mg | 9mg | 1% |
| Protein per 100 calories | 0.9g | 1.4g | N/A |
| Calories per 10 g protein | 1110kcal | 711kcal | N/A |
| Weight per 100 calories | 21g | 20g | N/A |
| Vitamin C | 0.5mg | 0.5mg | 0% |
| Net carbs | 70.4g | 60.95g | N/A |
| Calcium | 90mg | 90mg | 0% |
| Sugar | 58.94g | 46.54g | N/A |
| Fiber | 2g | 1.9g | 0% |
| Trans fat | 0.131g | 0.394g | N/A |
People also compare


References
All the values for which the sources are not specified explicitly are taken from FDA’s Food Central. The exact link to the food presented on this page can be found below.
- Mars - https://fdc.nal.usda.gov/fdc-app.html#/food-details/168814/nutrients
- Snickers - https://fdc.nal.usda.gov/fdc-app.html#/food-details/169663/nutrients
All the Daily Values are presented for males aged 31-50, for 2000-calorie diets.