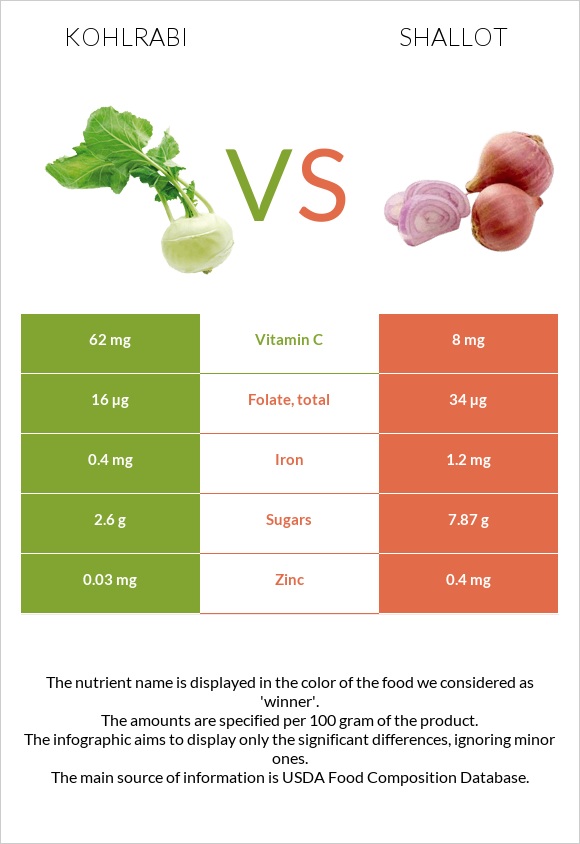
How are kohlrabi and shallots different? Kohlrabi is richer in vitamin C, while shallots are higher in vitamin B6, iron, and manganese. Kohlrabi covers your daily need for vitamin C, 60% more than shallots. Kohlrabi is lower in sugar. Kohlrabi, raw and Shallots, raw types were used in this article.
Infographic
Mineral Comparison
Mineral comparison score is based on the number of minerals by which one or the other food is richer. The "coverage" charts below show how much of the daily needs can be covered by 300 grams of the food.
1
100 g
300 g
1 slice - 16g 1 cup - 135g
Magnesium
Magnesium
Calcium
Calcium
Potassium
Potassium
Iron
Iron
Copper
Copper
Zinc
Zinc
Phosphorus
Phosphorus
Sodium
Sodium
Manganese
Manganese
Selenium
Selenium
14%
7.2%
31%
15%
43%
0.82%
20%
2.6%
18%
3.8%
8
100 g
300 g
1 tbsp chopped - 10g
Magnesium
Magnesium
Calcium
Calcium
Potassium
Potassium
Iron
Iron
Copper
Copper
Zinc
Zinc
Phosphorus
Phosphorus
Sodium
Sodium
Manganese
Manganese
Selenium
Selenium
15%
11%
29%
45%
29%
11%
26%
1.6%
38%
6.5%
Vitamin Comparison
Vitamin comparison score is based on the number of vitamins by which one or the other food is richer. The "coverage" charts below show how much of the daily needs can be covered by 300 grams of the food.
4
100 g
300 g
1 slice - 16g 1 cup - 135g
Vitamin C
Vit. C
Vitamin D
Vit. D
Vitamin A
Vit. A
Vitamin E
Vit. E
Vitamin B1
Vit. B1
Vitamin B2
Vit. B2
Vitamin B3
Vit. B3
Vitamin B5
Vit. B5
Vitamin B6
Vit. B6
Vitamin B12
Vit. B12
Vitamin K
Vit. K
Folate
Folate
207%
0%
0.67%
9.6%
13%
4.6%
7.5%
9.9%
35%
0%
0.25%
12%
5
100 g
300 g
1 tbsp chopped - 10g
Vitamin C
Vit. C
Vitamin D
Vit. D
Vitamin A
Vit. A
Vitamin E
Vit. E
Vitamin B1
Vit. B1
Vitamin B2
Vit. B2
Vitamin B3
Vit. B3
Vitamin B5
Vit. B5
Vitamin B6
Vit. B6
Vitamin B12
Vit. B12
Vitamin K
Vit. K
Folate
Folate
27%
0%
0%
0.8%
15%
4.6%
3.8%
17%
80%
0%
2%
26%
All nutrients comparison - raw data values
Nutrient
DV% diff.
Vitamin C
62mg
8mg
60%
Vitamin B6
0.15mg
0.345mg
15%
Iron
0.4mg
1.2mg
10%
Manganese
0.139mg
0.292mg
7%
Copper
0.129mg
0.088mg
5%
Folate
16µg
34µg
5%
Carbs
6.2g
16.8g
4%
Zinc
0.03mg
0.4mg
3%
Vitamin E
0.48mg
0.04mg
3%
Vitamin B5
0.165mg
0.29mg
3%
Calories
27kcal
72kcal
2%
Protein
1.7g
2.5g
2%
Fiber
3.6g
3.2g
2%
Phosphorus
46mg
60mg
2%
Calcium
24mg
37mg
1%
Selenium
0.7µg
1.2µg
1%
Vitamin B1
0.05mg
0.06mg
1%
Vitamin B3
0.4mg
0.2mg
1%
Vitamin K
0.1µg
0.8µg
1%
Protein per 100 calories
6.3g
3.5g
N/A
Calories per 10 g protein
159kcal
288kcal
N/A
Weight per 100 calories
370g
139g
N/A
Fats
0.1g
0.1g
0%
Net carbs
2.6g
13.6g
N/A
Magnesium
19mg
21mg
0%
Potassium
350mg
334mg
0%
Sugar
2.6g
7.87g
N/A
Sodium
20mg
12mg
0%
Vitamin A
2µg
0µg
0%
Vitamin B2
0.02mg
0.02mg
0%
Choline
12.3mg
11.3mg
0%
Saturated fat
0.013g
0.017g
0%
Monounsaturated fat
0.007g
0.014g
0%
Polyunsaturated fat
0.048g
0.039g
0%
Tryptophan
0.01mg
0.028mg
0%
Threonine
0.049mg
0.098mg
0%
Isoleucine
0.078mg
0.106mg
0%
Leucine
0.067mg
0.149mg
0%
Lysine
0.056mg
0.125mg
0%
Methionine
0.013mg
0.027mg
0%
Phenylalanine
0.039mg
0.081mg
0%
Valine
0.05mg
0.11mg
0%
Histidine
0.019mg
0.043mg
0%
Macronutrient Comparison
Macronutrient breakdown side-by-side comparison
2
2%
6%
91%
Protein:
1.7 g
Fats:
0.1 g
Carbs:
6.2 g
Water:
91 g
Other:
1 g
2
3%
17%
80%
Protein:
2.5 g
Fats:
0.1 g
Carbs:
16.8 g
Water:
79.8 g
Other:
0.8 g
Contains
more
Water Water
+14%
Contains
more
Other Other
+25%
Contains
more
Protein Protein
+47.1%
Contains
more
Carbs Carbs
+171%
Fat Type Comparison
Fat type breakdown side-by-side comparison
2
19%
10%
71%
Saturated fat:
Sat. Fat
0.013 g
Monounsaturated fat:
Mono. Fat
0.007 g
Polyunsaturated fat:
Poly. Fat
0.048 g
1
24%
20%
56%
Saturated fat:
Sat. Fat
0.017 g
Monounsaturated fat:
Mono. Fat
0.014 g
Polyunsaturated fat:
Poly. Fat
0.039 g
Contains
less
Sat. Fat Saturated fat
-23.5%
Contains
more
Poly. Fat Polyunsaturated fat
+23.1%
Contains
more
Mono. Fat Monounsaturated fat
+100%