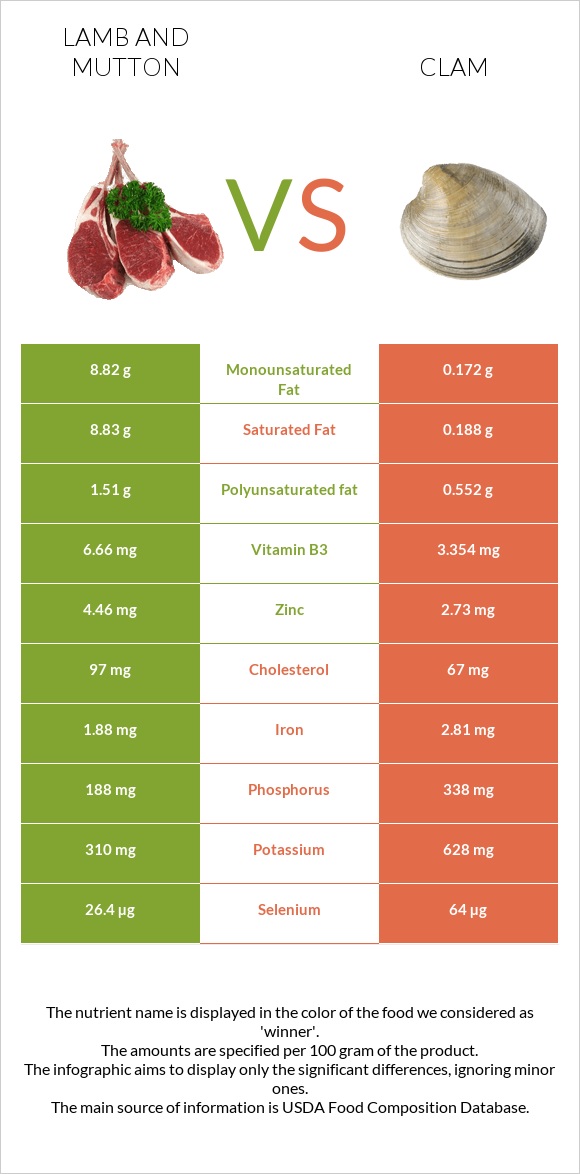
Differences between lamb and clam Lamb has more vitamin B3 and zinc, while clam has more vitamin B12, selenium, copper, manganese, vitamin C, and phosphorus. Clam's daily need coverage for vitamin B12 is 4014% higher. Clam contains 47 times less saturated fat than lamb. Lamb contains 8.83g of saturated fat, while clam contains 0.188g. Lamb has a lower glycemic index. The glycemic index of lamb is 0, while the glycemic index of clam is 27. The food types used in this comparison are Lamb, domestic, composite of trimmed retail cuts, separable lean, and fat, trimmed to 1/4" fat, choice, cooked and Mollusks, clam, mixed species, cooked, moist heat .
Infographic
Mineral Comparison
Mineral comparison score is based on the number of minerals by which one or the other food is richer. The "coverage" charts below show how much of the daily needs can be covered by 300 grams of the food.
3
100 g
300 g
3 oz - 85g 1 piece, cooked, excluding refuse (yield from 1 lb raw meat with refuse) - 242g
Magnesium
Magnesium
Calcium
Calcium
Potassium
Potassium
Iron
Iron
Copper
Copper
Zinc
Zinc
Phosphorus
Phosphorus
Sodium
Sodium
Manganese
Manganese
Selenium
Selenium
16%
5.1%
27%
71%
40%
122%
81%
9.4%
2.9%
144%
7
100 g
300 g
3 oz - 85g 20 small - 190g
Magnesium
Magnesium
Calcium
Calcium
Potassium
Potassium
Iron
Iron
Copper
Copper
Zinc
Zinc
Phosphorus
Phosphorus
Sodium
Sodium
Manganese
Manganese
Selenium
Selenium
13%
28%
55%
105%
229%
74%
145%
157%
130%
349%
Vitamin Comparison
Vitamin comparison score is based on the number of vitamins by which one or the other food is richer. The "coverage" charts below show how much of the daily needs can be covered by 300 grams of the food.
5
100 g
300 g
3 oz - 85g 1 piece, cooked, excluding refuse (yield from 1 lb raw meat with refuse) - 242g
Vitamin C
Vit. C
Vitamin D
Vit. D
Vitamin A
Vit. A
Vitamin E
Vit. E
Vitamin B1
Vit. B1
Vitamin B2
Vit. B2
Vitamin B3
Vit. B3
Vitamin B5
Vit. B5
Vitamin B6
Vit. B6
Vitamin B12
Vit. B12
Vitamin K
Vit. K
Folate
Folate
0%
1.5%
0%
2.8%
25%
58%
125%
40%
30%
319%
12%
14%
6
100 g
300 g
3 oz - 85g 20 small - 190g
Vitamin C
Vit. C
Vitamin D
Vit. D
Vitamin A
Vit. A
Vitamin E
Vit. E
Vitamin B1
Vit. B1
Vitamin B2
Vit. B2
Vitamin B3
Vit. B3
Vitamin B5
Vit. B5
Vitamin B6
Vit. B6
Vitamin B12
Vit. B12
Vitamin K
Vit. K
Folate
Folate
74%
0%
57%
0%
38%
98%
63%
41%
25%
12361%
0%
22%
All nutrients comparison - raw data values
Nutrient
DV% diff.
Vitamin B12
2.55µg
98.89µg
4014%
Selenium
26.4µg
64µg
68%
Copper
0.119mg
0.688mg
63%
Sodium
72mg
1202mg
49%
Manganese
0.022mg
1mg
43%
Saturated fat
8.83g
0.188g
39%
Fats
20.94g
1.95g
29%
Vitamin C
0mg
22.1mg
25%
Monounsaturated fat
8.82g
0.172g
22%
Phosphorus
188mg
338mg
21%
Vitamin B3
6.66mg
3.354mg
21%
Vitamin A
0µg
171µg
19%
Choline
93.7mg
17%
Zinc
4.46mg
2.73mg
16%
Vitamin B2
0.25mg
0.426mg
14%
Iron
1.88mg
2.81mg
12%
Cholesterol
97mg
67mg
10%
Potassium
310mg
628mg
9%
Calcium
17mg
92mg
8%
Calories
294kcal
148kcal
7%
Polyunsaturated fat
1.51g
0.552g
6%
Vitamin B1
0.1mg
0.15mg
4%
Vitamin K
4.6µg
4%
Folate
18µg
29µg
3%
Protein
24.52g
25.55g
2%
Carbs
0g
5.13g
2%
Vitamin B6
0.13mg
0.11mg
2%
Vitamin D
0.1µg
1%
Magnesium
23mg
18mg
1%
Vitamin E
0.14mg
1%
Protein per 100 calories
8.3g
17g
N/A
Calories per 10 g protein
120kcal
58kcal
N/A
Weight per 100 calories
34g
68g
N/A
Unsaturated / Saturated Fat ratio
1.2
3.9
N/A
Net carbs
0g
5.13g
N/A
Vitamin D*
2 IU
0%
Vitamin B5
0.66mg
0.68mg
0%
Tryptophan
0.287mg
0.286mg
0%
Threonine
1.05mg
1.099mg
0%
Isoleucine
1.183mg
1.112mg
0%
Leucine
1.908mg
1.798mg
0%
Lysine
2.166mg
1.909mg
0%
Methionine
0.629mg
0.576mg
0%
Phenylalanine
0.998mg
0.915mg
0%
Valine
1.323mg
1.116mg
0%
Histidine
0.777mg
0.49mg
0%
Omega-3 - EPA
0g
0.138g
N/A
Omega-3 - DHA
0g
0.146g
N/A
Omega-3 - DPA
0g
0.104g
N/A
Macronutrient Comparison
Macronutrient breakdown side-by-side comparison
1
25%
21%
54%
Protein:
24.52 g
Fats:
20.94 g
Carbs:
0 g
Water:
53.72 g
Other:
0.82 g
4
26%
2%
5%
64%
4%
Protein:
25.55 g
Fats:
1.95 g
Carbs:
5.13 g
Water:
63.64 g
Other:
3.73 g
Contains
more
Fats Fats
+973.8%
Contains
more
Carbs Carbs
+∞%
Contains
more
Water Water
+18.5%
Contains
more
Other Other
+354.9%
~equal in
Protein
~25.55g
Fat Type Comparison
Fat type breakdown side-by-side comparison
2
46%
46%
8%
Saturated fat:
Sat. Fat
8.83 g
Monounsaturated fat:
Mono. Fat
8.82 g
Polyunsaturated fat:
Poly. Fat
1.51 g
1
21%
19%
61%
Saturated fat:
Sat. Fat
0.188 g
Monounsaturated fat:
Mono. Fat
0.172 g
Polyunsaturated fat:
Poly. Fat
0.552 g
Contains
more
Mono. Fat Monounsaturated fat
+5027.9%
Contains
more
Poly. Fat Polyunsaturated fat
+173.6%
Contains
less
Sat. Fat Saturated fat
-97.9%