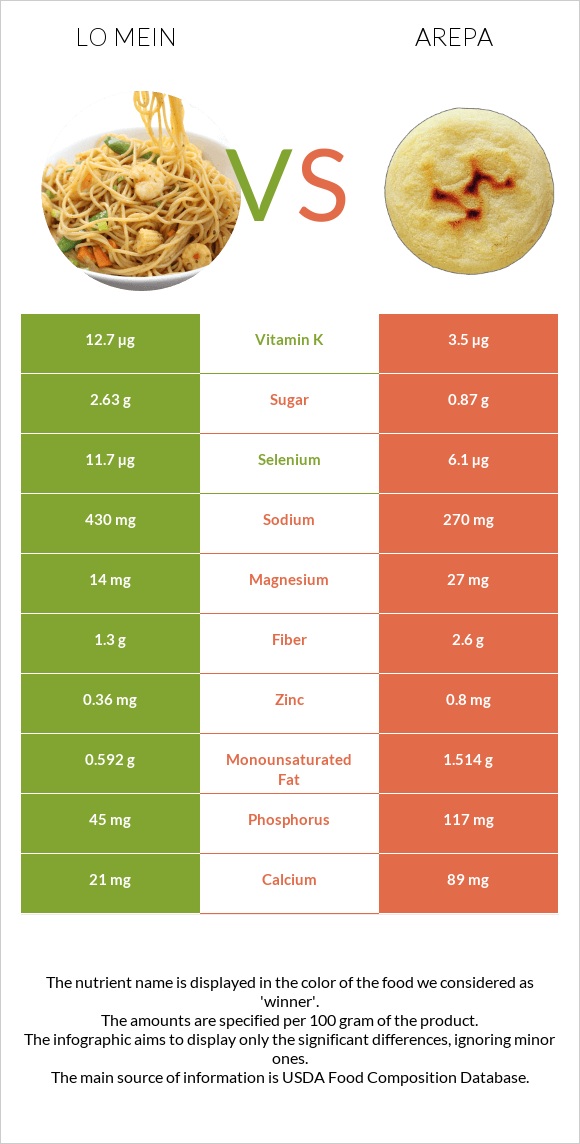
Significant differences between lo mein and arepa Lo mein has more selenium, vitamin K, vitamin B2, and manganese; however, arepa is richer in phosphorus, calcium, and fiber. Arepa covers your daily saturated fat needs 12% more than lo mein. Arepa has 4 times less vitamin K than lo mein. Lo mein has 12.7µg of vitamin K, while arepa has 3.5µg. Arepa contains less sodium. Specific food types used in this comparison are Restaurant, Chinese, vegetable lo mein, without meat and Restaurant, Latino, arepa (unleavened cornmeal bread) .
Infographic
Mineral Comparison
Mineral comparison score is based on the number of minerals by which one or the other food is richer. The "coverage" charts below show how much of the daily needs can be covered by 300 grams of the food.
4
100 g
300 g
1 cup - 136g 1 order - 741g
Magnesium
Magnesium
Calcium
Calcium
Potassium
Potassium
Iron
Iron
Copper
Copper
Zinc
Zinc
Phosphorus
Phosphorus
Sodium
Sodium
Manganese
Manganese
Selenium
Selenium
10%
6.3%
9.3%
40%
21%
9.8%
19%
56%
31%
64%
5
100 g
300 g
1 piece - 98g
Magnesium
Magnesium
Calcium
Calcium
Potassium
Potassium
Iron
Iron
Copper
Copper
Zinc
Zinc
Phosphorus
Phosphorus
Sodium
Sodium
Manganese
Manganese
Selenium
Selenium
19%
27%
7.8%
39%
10%
22%
50%
35%
15%
33%
Vitamin Comparison
Vitamin comparison score is based on the number of vitamins by which one or the other food is richer. The "coverage" charts below show how much of the daily needs can be covered by 300 grams of the food.
6
100 g
300 g
1 cup - 136g 1 order - 741g
Vitamin C
Vit. C
Vitamin D
Vit. D
Vitamin A
Vit. A
Vitamin E
Vit. E
Vitamin B1
Vit. B1
Vitamin B2
Vit. B2
Vitamin B3
Vit. B3
Vitamin B5
Vit. B5
Vitamin B6
Vit. B6
Vitamin B12
Vit. B12
Vitamin K
Vit. K
Folate
Folate
5.7%
1.5%
3%
6%
12%
29%
15%
16%
16%
0%
32%
21%
3
100 g
300 g
1 piece - 98g
Vitamin C
Vit. C
Vitamin D
Vit. D
Vitamin A
Vit. A
Vitamin E
Vit. E
Vitamin B1
Vit. B1
Vitamin B2
Vit. B2
Vitamin B3
Vit. B3
Vitamin B5
Vit. B5
Vitamin B6
Vit. B6
Vitamin B12
Vit. B12
Vitamin K
Vit. K
Folate
Folate
0%
0%
20%
5.8%
18%
9.7%
17%
12%
25%
0%
8.8%
0%
All nutrients comparison - raw data values
Nutrient
DV% diff.
Saturated fat
0.464g
2.902g
11%
Phosphorus
45mg
117mg
10%
Selenium
11.7µg
6.1µg
10%
Vitamin K
12.7µg
3.5µg
8%
Calcium
21mg
89mg
7%
Starch
16.73g
7%
Sodium
430mg
270mg
7%
Folate
28µg
7%
Carbs
20.16g
37.14g
6%
Vitamin A
9µg
61µg
6%
Vitamin B2
0.124mg
0.042mg
6%
Calories
121kcal
219kcal
5%
Fats
2.35g
5.38g
5%
Fiber
1.3g
2.6g
5%
Manganese
0.24mg
0.116mg
5%
Copper
0.064mg
0.03mg
4%
Zinc
0.36mg
0.8mg
4%
Magnesium
14mg
27mg
3%
Vitamin B6
0.068mg
0.107mg
3%
Vitamin C
1.7mg
2%
Cholesterol
0mg
5mg
2%
Vitamin B1
0.047mg
0.07mg
2%
Monounsaturated fat
0.592g
1.514g
2%
Polyunsaturated fat
1.291g
0.989g
2%
Protein
4.77g
5.48g
1%
Vitamin D*
4 IU
1%
Vitamin D
0.1µg
1%
Potassium
105mg
88mg
1%
Vitamin B5
0.27mg
0.202mg
1%
Choline
8.9mg
4.4mg
1%
Protein per 100 calories
3.9g
2.5g
N/A
Calories per 10 g protein
254kcal
400kcal
N/A
Weight per 100 calories
83g
46g
N/A
Unsaturated / Saturated Fat ratio
4.1
0.86
N/A
Net carbs
18.86g
34.54g
N/A
Iron
1.07mg
1.04mg
0%
Sugar
2.63g
0.87g
N/A
Vitamin E
0.3mg
0.29mg
0%
Vitamin B3
0.81mg
0.888mg
0%
Trans fat
0.008g
0.157g
N/A
Tryptophan
0.048mg
0%
Threonine
0.193mg
0%
Isoleucine
0.207mg
0%
Leucine
0.671mg
0%
Lysine
0.228mg
0%
Methionine
0.131mg
0%
Phenylalanine
0.276mg
0%
Valine
0.276mg
0%
Histidine
0.166mg
0%
Fructose
0.33g
0g
0%
Omega-3 - EPA
0g
0.003g
N/A
Omega-3 - ALA
0.141g
0.065g
N/A
Omega-3 - DPA
0g
0.003g
N/A
Omega-6 - Gamma-linoleic acid
0.004g
0.002g
N/A
Omega-6 - Dihomo-gamma-linoleic acid
0g
0.005g
N/A
Omega-6 - Eicosadienoic acid
0.001g
0.003g
N/A
Omega-6 - Linoleic acid
1.134g
0.825g
N/A
Macronutrient Comparison
Macronutrient breakdown side-by-side comparison
2
5%
2%
20%
71%
Protein:
4.77 g
Fats:
2.35 g
Carbs:
20.16 g
Water:
71.33 g
Other:
1.39 g
3
5%
5%
37%
51%
Protein:
5.48 g
Fats:
5.38 g
Carbs:
37.14 g
Water:
50.8 g
Other:
1.2 g
Contains
more
Water Water
+40.4%
Contains
more
Other Other
+15.8%
Contains
more
Protein Protein
+14.9%
Contains
more
Fats Fats
+128.9%
Contains
more
Carbs Carbs
+84.2%
Fat Type Comparison
Fat type breakdown side-by-side comparison
2
20%
25%
55%
Saturated fat:
Sat. Fat
0.464 g
Monounsaturated fat:
Mono. Fat
0.592 g
Polyunsaturated fat:
Poly. Fat
1.291 g
1
54%
28%
18%
Saturated fat:
Sat. Fat
2.902 g
Monounsaturated fat:
Mono. Fat
1.514 g
Polyunsaturated fat:
Poly. Fat
0.989 g
Contains
less
Sat. Fat Saturated fat
-84%
Contains
more
Poly. Fat Polyunsaturated fat
+30.5%
Contains
more
Mono. Fat Monounsaturated fat
+155.7%
Carbohydrate type comparison
Carbohydrate type breakdown side-by-side comparison
4
86%
8%
2%
2%
Starch:
16.73 g
Sucrose:
1.63 g
Glucose:
0.37 g
Fructose:
0.33 g
Lactose:
0 g
Maltose:
0.3 g
Galactose:
0 g
1
45%
55%
Starch:
0 g
Sucrose:
0.33 g
Glucose:
0 g
Fructose:
0 g
Lactose:
0 g
Maltose:
0.41 g
Galactose:
0 g
Contains
more
Starch Starch
+∞%
Contains
more
Sucrose Sucrose
+393.9%
Contains
more
Glucose Glucose
+∞%
Contains
more
Fructose Fructose
+∞%
Contains
more
Maltose Maltose
+36.7%
~equal in
Lactose
~0g
~equal in
Galactose
~0g