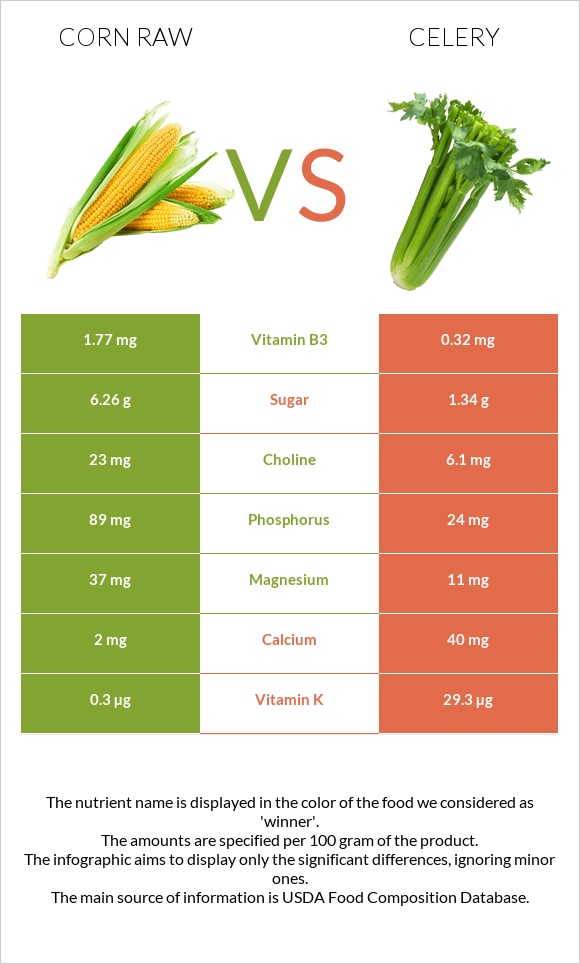
Significant differences between corn raw and celery Corn raw has more vitamin B1, vitamin B5, phosphorus, vitamin B3, and magnesium; however, celery is richer in vitamin K and vitamin A. Celery covers your daily vitamin K needs 24% more than corn raw. Celery has 7 times less vitamin B1 than corn raw. Corn raw has 0.155mg of vitamin B1, while celery has 0.021mg. Celery contains less sugar. Corn raw has a higher glycemic index. The glycemic index of corn raw is 52, while the glycemic index of celery is 32. Specific food types used in this comparison are Corn, sweet, yellow, raw and Celery, raw .
Infographic
Mineral Comparison
Mineral comparison score is based on the number of minerals by which one or the other food is richer. The "coverage" charts below show how much of the daily needs can be covered by 300 grams of the food.
8
100 g
300 g
1 ear, small (5-1/2" to 6-1/2" long) - 73g 1 ear, medium (6-3/4" to 7-1/2" long) yields - 102g 1 ear, large (7-3/4" to 9" long) yields - 143g 1 cup - 145g
Magnesium
Magnesium
Calcium
Calcium
Potassium
Potassium
Iron
Iron
Copper
Copper
Zinc
Zinc
Phosphorus
Phosphorus
Sodium
Sodium
Manganese
Manganese
Selenium
Selenium
26%
0.6%
24%
20%
18%
13%
38%
2%
21%
3.3%
1
100 g
300 g
1 strip (4" long) - 4g 1 tbsp - 7.5g 1 stalk, small (5" long) - 17g 1 stalk, medium (7-1/2" - 8" long) - 40g 1 stalk, large (11"-12" long) - 64g 1 cup chopped - 101g 1 NLEA serving - 110g
Magnesium
Magnesium
Calcium
Calcium
Potassium
Potassium
Iron
Iron
Copper
Copper
Zinc
Zinc
Phosphorus
Phosphorus
Sodium
Sodium
Manganese
Manganese
Selenium
Selenium
7.9%
12%
23%
7.5%
12%
3.5%
10%
10%
13%
2.2%
Vitamin Comparison
Vitamin comparison score is based on the number of vitamins by which one or the other food is richer. The "coverage" charts below show how much of the daily needs can be covered by 300 grams of the food.
6
100 g
300 g
1 ear, small (5-1/2" to 6-1/2" long) - 73g 1 ear, medium (6-3/4" to 7-1/2" long) yields - 102g 1 ear, large (7-3/4" to 9" long) yields - 143g 1 cup - 145g
Vitamin C
Vit. C
Vitamin D
Vit. D
Vitamin A
Vit. A
Vitamin E
Vit. E
Vitamin B1
Vit. B1
Vitamin B2
Vit. B2
Vitamin B3
Vit. B3
Vitamin B5
Vit. B5
Vitamin B6
Vit. B6
Vitamin B12
Vit. B12
Vitamin K
Vit. K
Folate
Folate
23%
0%
3%
1.4%
39%
13%
33%
43%
21%
0%
0.75%
32%
3
100 g
300 g
1 strip (4" long) - 4g 1 tbsp - 7.5g 1 stalk, small (5" long) - 17g 1 stalk, medium (7-1/2" - 8" long) - 40g 1 stalk, large (11"-12" long) - 64g 1 cup chopped - 101g 1 NLEA serving - 110g
Vitamin C
Vit. C
Vitamin D
Vit. D
Vitamin A
Vit. A
Vitamin E
Vit. E
Vitamin B1
Vit. B1
Vitamin B2
Vit. B2
Vitamin B3
Vit. B3
Vitamin B5
Vit. B5
Vitamin B6
Vit. B6
Vitamin B12
Vit. B12
Vitamin K
Vit. K
Folate
Folate
10%
0%
7.3%
5.4%
5.3%
13%
6%
15%
17%
0%
73%
27%
All nutrients comparison - raw data values
Nutrient
DV% diff.
Vitamin K
0.3µg
29.3µg
24%
Vitamin B1
0.155mg
0.021mg
11%
Phosphorus
89mg
24mg
9%
Vitamin B3
1.77mg
0.32mg
9%
Vitamin B5
0.717mg
0.246mg
9%
Magnesium
37mg
11mg
6%
Protein
3.27g
0.69g
5%
Carbs
18.7g
2.97g
5%
Calories
86kcal
16kcal
4%
Vitamin C
6.8mg
3.1mg
4%
Calcium
2mg
40mg
4%
Iron
0.52mg
0.2mg
4%
Zinc
0.46mg
0.13mg
3%
Sodium
15mg
80mg
3%
Manganese
0.163mg
0.103mg
3%
Choline
23mg
6.1mg
3%
Polyunsaturated fat
0.487g
0.079g
3%
Fats
1.35g
0.17g
2%
Fiber
2g
1.6g
2%
Copper
0.054mg
0.035mg
2%
Starch
5.7g
0g
2%
Folate
42µg
36µg
2%
Fructose
1.94g
0.37g
2%
Vitamin A
9µg
22µg
1%
Vitamin E
0.07mg
0.27mg
1%
Vitamin B6
0.093mg
0.074mg
1%
Saturated fat
0.325g
0.042g
1%
Monounsaturated fat
0.432g
0.032g
1%
Protein per 100 calories
3.8g
4.3g
N/A
Calories per 10 g protein
263kcal
232kcal
N/A
Weight per 100 calories
116g
625g
N/A
Net carbs
16.7g
1.37g
N/A
Potassium
270mg
260mg
0%
Sugar
6.26g
1.34g
N/A
Selenium
0.6µg
0.4µg
0%
Vitamin B2
0.055mg
0.057mg
0%
Tryptophan
0.023mg
0.009mg
0%
Threonine
0.129mg
0.02mg
0%
Isoleucine
0.129mg
0.021mg
0%
Leucine
0.348mg
0.032mg
0%
Lysine
0.137mg
0.027mg
0%
Methionine
0.067mg
0.005mg
0%
Phenylalanine
0.15mg
0.02mg
0%
Valine
0.185mg
0.027mg
0%
Histidine
0.089mg
0.012mg
0%
Omega-3 - ALA
0.014g
N/A
Omega-6 - Linoleic acid
0.468g
N/A
Macronutrient Comparison
Macronutrient breakdown side-by-side comparison
3
3%
19%
76%
Protein:
3.27 g
Fats:
1.35 g
Carbs:
18.7 g
Water:
76.05 g
Other:
0.63 g
2
3%
95%
Protein:
0.69 g
Fats:
0.17 g
Carbs:
2.97 g
Water:
95.43 g
Other:
0.74 g
Contains
more
Protein Protein
+373.9%
Contains
more
Fats Fats
+694.1%
Contains
more
Carbs Carbs
+529.6%
Contains
more
Water Water
+25.5%
Contains
more
Other Other
+17.5%
Fat Type Comparison
Fat type breakdown side-by-side comparison
2
26%
35%
39%
Saturated fat:
Sat. Fat
0.325 g
Monounsaturated fat:
Mono. Fat
0.432 g
Polyunsaturated fat:
Poly. Fat
0.487 g
1
27%
21%
52%
Saturated fat:
Sat. Fat
0.042 g
Monounsaturated fat:
Mono. Fat
0.032 g
Polyunsaturated fat:
Poly. Fat
0.079 g
Contains
more
Mono. Fat Monounsaturated fat
+1250%
Contains
more
Poly. Fat Polyunsaturated fat
+516.5%
Contains
less
Sat. Fat Saturated fat
-87.1%
Carbohydrate type comparison
Carbohydrate type breakdown side-by-side comparison
4
48%
7%
29%
16%
Starch:
5.7 g
Sucrose:
0.89 g
Glucose:
3.43 g
Fructose:
1.94 g
Lactose:
0 g
Maltose:
0 g
Galactose:
0 g
1
6%
30%
28%
36%
Starch:
0 g
Sucrose:
0.08 g
Glucose:
0.4 g
Fructose:
0.37 g
Lactose:
0 g
Maltose:
0 g
Galactose:
0.48 g
Contains
more
Starch Starch
+∞%
Contains
more
Sucrose Sucrose
+1012.5%
Contains
more
Glucose Glucose
+757.5%
Contains
more
Fructose Fructose
+424.3%
Contains
more
Galactose Galactose
+∞%
~equal in
Lactose
~0g
~equal in
Maltose
~0g