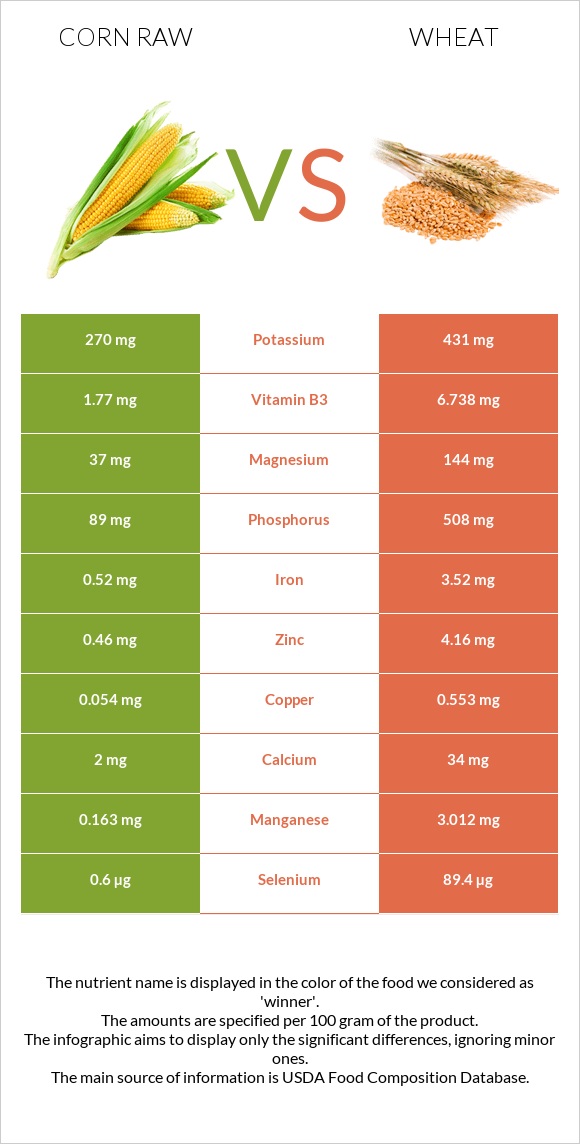
Summary of differences between corn raw and wheat Corn raw has less selenium, manganese, phosphorus, copper, iron, zinc, vitamin B3, magnesium, vitamin B6, and vitamin B1 than wheat . Wheat covers your daily need for selenium, 161% more than corn raw. These are the specific foods used in this comparison Corn, sweet, yellow, raw and Wheat, durum .
Infographic
Mineral Comparison
Mineral comparison score is based on the number of minerals by which one or the other food is richer. The "coverage" charts below show how much of the daily needs can be covered by 300 grams of the food.
0
100 g
300 g
1 ear, small (5-1/2" to 6-1/2" long) - 73g 1 ear, medium (6-3/4" to 7-1/2" long) yields - 102g 1 ear, large (7-3/4" to 9" long) yields - 143g 1 cup - 145g
Magnesium
Magnesium
Calcium
Calcium
Potassium
Potassium
Iron
Iron
Copper
Copper
Zinc
Zinc
Phosphorus
Phosphorus
Sodium
Sodium
Manganese
Manganese
Selenium
Selenium
26%
0.6%
24%
20%
18%
13%
38%
2%
21%
3.3%
10
100 g
300 g
1 cup - 192g
Magnesium
Magnesium
Calcium
Calcium
Potassium
Potassium
Iron
Iron
Copper
Copper
Zinc
Zinc
Phosphorus
Phosphorus
Sodium
Sodium
Manganese
Manganese
Selenium
Selenium
103%
10%
38%
132%
184%
113%
218%
0.26%
393%
488%
Vitamin Comparison
Vitamin comparison score is based on the number of vitamins by which one or the other food is richer. The "coverage" charts below show how much of the daily needs can be covered by 300 grams of the food.
4
100 g
300 g
1 ear, small (5-1/2" to 6-1/2" long) - 73g 1 ear, medium (6-3/4" to 7-1/2" long) yields - 102g 1 ear, large (7-3/4" to 9" long) yields - 143g 1 cup - 145g
Vitamin C
Vit. C
Vitamin D
Vit. D
Vitamin A
Vit. A
Vitamin E
Vit. E
Vitamin B1
Vit. B1
Vitamin B2
Vit. B2
Vitamin B3
Vit. B3
Vitamin B5
Vit. B5
Vitamin B6
Vit. B6
Vitamin B12
Vit. B12
Vitamin K
Vit. K
Folate
Folate
23%
0%
3%
1.4%
39%
13%
33%
43%
21%
0%
0.75%
32%
5
100 g
300 g
1 cup - 192g
Vitamin C
Vit. C
Vitamin D
Vit. D
Vitamin A
Vit. A
Vitamin E
Vit. E
Vitamin B1
Vit. B1
Vitamin B2
Vit. B2
Vitamin B3
Vit. B3
Vitamin B5
Vit. B5
Vitamin B6
Vit. B6
Vitamin B12
Vit. B12
Vitamin K
Vit. K
Folate
Folate
0%
0%
0%
0%
105%
28%
126%
56%
97%
0%
0%
32%
All nutrients comparison - raw data values
Nutrient
DV% diff.
Selenium
0.6µg
89.4µg
161%
Manganese
0.163mg
3.012mg
124%
Phosphorus
89mg
508mg
60%
Copper
0.054mg
0.553mg
55%
Iron
0.52mg
3.52mg
38%
Zinc
0.46mg
4.16mg
34%
Vitamin B3
1.77mg
6.738mg
31%
Magnesium
37mg
144mg
25%
Vitamin B6
0.093mg
0.419mg
25%
Vitamin B1
0.155mg
0.419mg
22%
Protein
3.27g
13.68g
21%
Carbs
18.7g
71.13g
17%
Calories
86kcal
339kcal
13%
Vitamin C
6.8mg
0mg
8%
Fiber
2g
8%
Potassium
270mg
431mg
5%
Vitamin B2
0.055mg
0.121mg
5%
Vitamin B5
0.717mg
0.935mg
4%
Choline
23mg
4%
Calcium
2mg
34mg
3%
Polyunsaturated fat
0.487g
0.978g
3%
Fats
1.35g
2.47g
2%
Starch
5.7g
2%
Fructose
1.94g
2%
Sodium
15mg
2mg
1%
Vitamin A
9µg
0µg
1%
Saturated fat
0.325g
0.454g
1%
Protein per 100 calories
3.8g
4g
N/A
Calories per 10 g protein
263kcal
248kcal
N/A
Weight per 100 calories
116g
29g
N/A
Unsaturated / Saturated Fat ratio
2.8
2.9
N/A
Net carbs
16.7g
71.13g
N/A
Sugar
6.26g
N/A
Vitamin E
0.07mg
0%
Vitamin K
0.3µg
0%
Folate
42µg
43µg
0%
Monounsaturated fat
0.432g
0.344g
0%
Tryptophan
0.023mg
0.176mg
0%
Threonine
0.129mg
0.366mg
0%
Isoleucine
0.129mg
0.533mg
0%
Leucine
0.348mg
0.934mg
0%
Lysine
0.137mg
0.303mg
0%
Methionine
0.067mg
0.221mg
0%
Phenylalanine
0.15mg
0.681mg
0%
Valine
0.185mg
0.594mg
0%
Histidine
0.089mg
0.322mg
0%
Omega-3 - ALA
0.014g
N/A
Omega-6 - Linoleic acid
0.468g
N/A
Macronutrient Comparison
Macronutrient breakdown side-by-side comparison
1
3%
19%
76%
Protein:
3.27 g
Fats:
1.35 g
Carbs:
18.7 g
Water:
76.05 g
Other:
0.63 g
4
14%
2%
71%
11%
2%
Protein:
13.68 g
Fats:
2.47 g
Carbs:
71.13 g
Water:
10.94 g
Other:
1.78 g
Contains
more
Water Water
+595.2%
Contains
more
Protein Protein
+318.3%
Contains
more
Fats Fats
+83%
Contains
more
Carbs Carbs
+280.4%
Contains
more
Other Other
+182.5%
Fat Type Comparison
Fat type breakdown side-by-side comparison
2
26%
35%
39%
Saturated fat:
Sat. Fat
0.325 g
Monounsaturated fat:
Mono. Fat
0.432 g
Polyunsaturated fat:
Poly. Fat
0.487 g
1
26%
19%
55%
Saturated fat:
Sat. Fat
0.454 g
Monounsaturated fat:
Mono. Fat
0.344 g
Polyunsaturated fat:
Poly. Fat
0.978 g
Contains
less
Sat. Fat Saturated fat
-28.4%
Contains
more
Mono. Fat Monounsaturated fat
+25.6%
Contains
more
Poly. Fat Polyunsaturated fat
+100.8%