What are the differences between corn and wheat? Corn is higher in vitamin B6 and vitamin A; however, wheat is richer in selenium, manganese, copper, iron, zinc, phosphorus, fiber, and magnesium. Wheat's daily need coverage for selenium is 58% more. Wheat contains 66 times less vitamin A than corn. Corn contains 263 IU of vitamin A, while wheat contains 4 IU. We used Corn, sweet, yellow, cooked, boiled, drained, without salt and Wheat, KAMUT khorasan, cooked types in this article.
Infographic
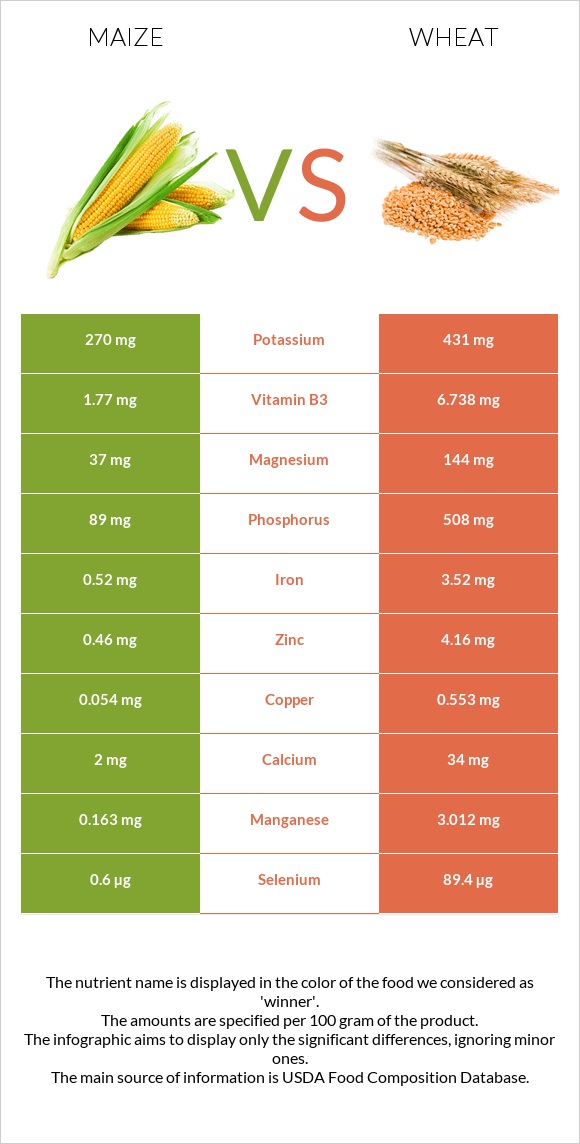
Mineral Comparison
Mineral comparison score is based on the number of minerals by which one or the other food is richer. The "coverage" charts below show how much of the daily needs can be covered by 300 grams of the food.
2
100 g
300 g
1 baby ear - 8g 1 ear small (5-1/2" to 6-1/2" long) - 89g 1 ear medium (6-3/4" to 7-1/2" long) - 103g 1 ear large (7-3/4" to 9" long) - 118g 1 cup cut - 149g
Magnesium
Magnesium
Calcium
Calcium
Potassium
Potassium
Iron
Iron
Copper
Copper
Zinc
Zinc
Phosphorus
Phosphorus
Sodium
Sodium
Manganese
Manganese
Selenium
Selenium
19%
0.9%
19%
17%
16%
17%
33%
0.13%
22%
1.1%
8
100 g
300 g
1 cup - 172g
Magnesium
Magnesium
Calcium
Calcium
Potassium
Potassium
Iron
Iron
Copper
Copper
Zinc
Zinc
Phosphorus
Phosphorus
Sodium
Sodium
Manganese
Manganese
Selenium
Selenium
34%
2.7%
14%
66%
69%
50%
63%
1%
134%
174%
Vitamin Comparison
Vitamin comparison score is based on the number of vitamins by which one or the other food is richer. The "coverage" charts below show how much of the daily needs can be covered by 300 grams of the food.
7
100 g
300 g
1 baby ear - 8g 1 ear small (5-1/2" to 6-1/2" long) - 89g 1 ear medium (6-3/4" to 7-1/2" long) - 103g 1 ear large (7-3/4" to 9" long) - 118g 1 cup cut - 149g
Vitamin C
Vit. C
Vitamin D
Vit. D
Vitamin A
Vit. A
Vitamin E
Vit. E
Vitamin B1
Vit. B1
Vitamin B2
Vit. B2
Vitamin B3
Vit. B3
Vitamin B5
Vit. B5
Vitamin B6
Vit. B6
Vitamin B12
Vit. B12
Vitamin K
Vit. K
Folate
Folate
18%
0%
4.3%
1.8%
23%
13%
32%
48%
32%
0%
1%
17%
2
100 g
300 g
1 cup - 172g
Vitamin C
Vit. C
Vitamin D
Vit. D
Vitamin A
Vit. A
Vitamin E
Vit. E
Vitamin B1
Vit. B1
Vitamin B2
Vit. B2
Vitamin B3
Vit. B3
Vitamin B5
Vit. B5
Vitamin B6
Vit. B6
Vitamin B12
Vit. B12
Vitamin K
Vit. K
Folate
Folate
0%
0%
0%
4.8%
24%
6.9%
43%
0%
16%
0%
0%
8.3%
All nutrients comparison - raw data values
Nutrient
DV% diff.
Selenium
0.2µg
31.9µg
58%
Manganese
0.167mg
1.03mg
38%
Copper
0.049mg
0.207mg
18%
Iron
0.45mg
1.76mg
16%
Vitamin B5
0.792mg
16%
Zinc
0.62mg
1.84mg
11%
Phosphorus
77mg
147mg
10%
Fiber
2.4g
4.3g
8%
Vitamin C
5.5mg
6%
Protein
3.41g
5.71g
5%
Magnesium
26mg
48mg
5%
Vitamin B6
0.139mg
0.07mg
5%
Choline
29.1mg
5%
Vitamin B3
1.683mg
2.305mg
4%
Starch
7.17g
3%
Folate
23µg
11µg
3%
Calories
96kcal
132kcal
2%
Carbs
20.98g
27.6g
2%
Potassium
218mg
164mg
2%
Vitamin B2
0.057mg
0.03mg
2%
Polyunsaturated fat
0.603g
0.243g
2%
Fats
1.5g
0.83g
1%
Calcium
3mg
9mg
1%
Vitamin A
13µg
1%
Vitamin E
0.09mg
0.24mg
1%
Saturated fat
0.197g
0.077g
1%
Monounsaturated fat
0.374g
0.084g
1%
Fructose
0.79g
1%
Protein per 100 calories
3.6g
4.3g
N/A
Calories per 10 g protein
282kcal
231kcal
N/A
Weight per 100 calories
104g
76g
N/A
Net carbs
18.58g
23.3g
N/A
Sugar
4.54g
3.07g
N/A
Sodium
1mg
8mg
0%
Vitamin B1
0.093mg
0.095mg
0%
Vitamin K
0.4µg
0%
Trans fat
0g
0.002g
N/A
Tryptophan
0.023mg
0.051mg
0%
Threonine
0.133mg
0.172mg
0%
Isoleucine
0.133mg
0.22mg
0%
Leucine
0.358mg
0.432mg
0%
Lysine
0.141mg
0.161mg
0%
Methionine
0.069mg
0.097mg
0%
Phenylalanine
0.155mg
0.3mg
0%
Valine
0.191mg
0.267mg
0%
Histidine
0.091mg
0.147mg
0%
Macronutrient Comparison
Macronutrient breakdown side-by-side comparison
3
3%
21%
73%
Protein:
3.41 g
Fats:
1.5 g
Carbs:
20.98 g
Water:
73.41 g
Other:
0.7 g
2
6%
28%
65%
Protein:
5.71 g
Fats:
0.83 g
Carbs:
27.6 g
Water:
65.18 g
Other:
0.68 g
Contains
more
Fats Fats
+80.7%
Contains
more
Water Water
+12.6%
Contains
more
Protein Protein
+67.4%
Contains
more
Carbs Carbs
+31.6%
Fat Type Comparison
Fat type breakdown side-by-side comparison
2
17%
32%
51%
Saturated fat:
Sat. Fat
0.197 g
Monounsaturated fat:
Mono. Fat
0.374 g
Polyunsaturated fat:
Poly. Fat
0.603 g
1
19%
21%
60%
Saturated fat:
Sat. Fat
0.077 g
Monounsaturated fat:
Mono. Fat
0.084 g
Polyunsaturated fat:
Poly. Fat
0.243 g
Contains
more
Mono. Fat Monounsaturated fat
+345.2%
Contains
more
Poly. Fat Polyunsaturated fat
+148.1%
Contains
less
Sat. Fat Saturated fat
-60.9%