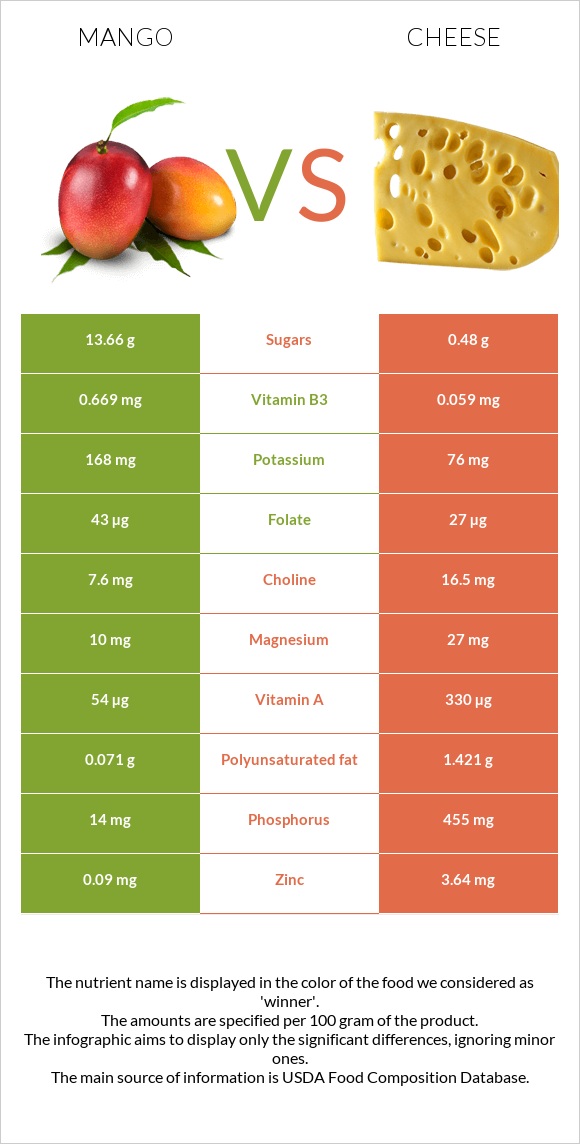
A recap on the differences between mango and cheese Mango is higher in vitamin C, yet cheese is higher in calcium, phosphorus, selenium, vitamin B12, zinc, and vitamin B2. Cheese covers your daily saturated fat needs 94% more than mango. The amount of saturated fat in mango is lower. The glycemic index of cheese is lower. Food varieties used in this article are Mangos, raw and Cheese, cheddar .
Infographic
Mineral Comparison
Mineral comparison score is based on the number of minerals by which one or the other food is richer. The "coverage" charts below show how much of the daily needs can be covered by 300 grams of the food.
5
100 g
300 g
1 cup pieces - 165g 1 fruit without refuse - 336g
Magnesium
Magnesium
Calcium
Calcium
Potassium
Potassium
Iron
Iron
Copper
Copper
Zinc
Zinc
Phosphorus
Phosphorus
Sodium
Sodium
Manganese
Manganese
Selenium
Selenium
7.1%
3.3%
15%
6%
37%
2.5%
6%
0.13%
8.2%
3.3%
5
100 g
300 g
1 cubic inch - 17g 1 slice (1 oz) - 28g 1 oz - 28.35g 1 cup, shredded - 113g 1 cup, diced - 132g 1 cup, melted - 244g
Magnesium
Magnesium
Calcium
Calcium
Potassium
Potassium
Iron
Iron
Copper
Copper
Zinc
Zinc
Phosphorus
Phosphorus
Sodium
Sodium
Manganese
Manganese
Selenium
Selenium
19%
213%
6.7%
5.3%
10%
99%
195%
85%
3.5%
155%
Vitamin Comparison
Vitamin comparison score is based on the number of vitamins by which one or the other food is richer. The "coverage" charts below show how much of the daily needs can be covered by 300 grams of the food.
6
100 g
300 g
1 cup pieces - 165g 1 fruit without refuse - 336g
Vitamin C
Vit. C
Vitamin D
Vit. D
Vitamin A
Vit. A
Vitamin E
Vit. E
Vitamin B1
Vit. B1
Vitamin B2
Vit. B2
Vitamin B3
Vit. B3
Vitamin B5
Vit. B5
Vitamin B6
Vit. B6
Vitamin B12
Vit. B12
Vitamin K
Vit. K
Folate
Folate
121%
0%
18%
18%
7%
8.8%
13%
12%
27%
0%
11%
32%
5
100 g
300 g
1 cubic inch - 17g 1 slice (1 oz) - 28g 1 oz - 28.35g 1 cup, shredded - 113g 1 cup, diced - 132g 1 cup, melted - 244g
Vitamin C
Vit. C
Vitamin D
Vit. D
Vitamin A
Vit. A
Vitamin E
Vit. E
Vitamin B1
Vit. B1
Vitamin B2
Vit. B2
Vitamin B3
Vit. B3
Vitamin B5
Vit. B5
Vitamin B6
Vit. B6
Vitamin B12
Vit. B12
Vitamin K
Vit. K
Folate
Folate
0%
9%
110%
14%
7.3%
99%
1.1%
25%
15%
138%
6%
20%
All nutrients comparison - raw data values
Nutrient
DV% diff.
Saturated fat
0.092g
18.867g
85%
Calcium
11mg
710mg
70%
Phosphorus
14mg
455mg
63%
Fats
0.38g
33.31g
51%
Selenium
0.6µg
28.5µg
51%
Vitamin B12
0µg
1.1µg
46%
Protein
0.82g
22.87g
44%
Vitamin C
36.4mg
0mg
40%
Cholesterol
0mg
99mg
33%
Zinc
0.09mg
3.64mg
32%
Vitamin A
54µg
330µg
31%
Vitamin B2
0.038mg
0.428mg
30%
Sodium
1mg
653mg
28%
Monounsaturated fat
0.14g
9.246g
23%
Calories
60kcal
404kcal
17%
Copper
0.111mg
0.03mg
9%
Polyunsaturated fat
0.071g
1.421g
9%
Fiber
1.6g
0g
6%
Fructose
4.68g
0g
6%
Carbs
14.98g
3.09g
4%
Magnesium
10mg
27mg
4%
Vitamin B3
0.669mg
0.059mg
4%
Vitamin B5
0.197mg
0.41mg
4%
Vitamin B6
0.119mg
0.066mg
4%
Folate
43µg
27µg
4%
Vitamin D*
0 IU
24 IU
3%
Vitamin D
0µg
0.6µg
3%
Potassium
168mg
76mg
3%
Manganese
0.063mg
0.027mg
2%
Vitamin K
4.2µg
2.4µg
2%
Choline
7.6mg
16.5mg
2%
Vitamin E
0.9mg
0.71mg
1%
Protein per 100 calories
1.4g
5.7g
N/A
Calories per 10 g protein
732kcal
177kcal
N/A
Weight per 100 calories
167g
25g
N/A
Unsaturated / Saturated Fat ratio
2.3
0.57
N/A
Net carbs
13.38g
3.09g
N/A
Iron
0.16mg
0.14mg
0%
Sugar
13.66g
0.48g
N/A
Vitamin B1
0.028mg
0.029mg
0%
Trans fat
0g
0.917g
N/A
Tryptophan
0.013mg
0.547mg
0%
Threonine
0.031mg
1.044mg
0%
Isoleucine
0.029mg
1.206mg
0%
Leucine
0.05mg
1.939mg
0%
Lysine
0.066mg
1.025mg
0%
Methionine
0.008mg
0.547mg
0%
Phenylalanine
0.027mg
1.074mg
0%
Valine
0.042mg
1.404mg
0%
Histidine
0.019mg
0.547mg
0%
Omega-3 - EPA
0g
0.01g
N/A
Omega-3 - DHA
0g
0.001g
N/A
Omega-3 - DPA
0g
0.017g
N/A
Omega-6 - Eicosadienoic acid
0.007g
N/A
Macronutrient Comparison
Macronutrient breakdown side-by-side comparison
2
15%
83%
Protein:
0.82 g
Fats:
0.38 g
Carbs:
14.98 g
Water:
83.46 g
Other:
0.36 g
3
23%
33%
3%
37%
4%
Protein:
22.87 g
Fats:
33.31 g
Carbs:
3.09 g
Water:
37.02 g
Other:
3.71 g
Contains
more
Carbs Carbs
+384.8%
Contains
more
Water Water
+125.4%
Contains
more
Protein Protein
+2689%
Contains
more
Fats Fats
+8665.8%
Contains
more
Other Other
+930.6%
Fat Type Comparison
Fat type breakdown side-by-side comparison
1
30%
46%
23%
Saturated fat:
Sat. Fat
0.092 g
Monounsaturated fat:
Mono. Fat
0.14 g
Polyunsaturated fat:
Poly. Fat
0.071 g
2
64%
31%
5%
Saturated fat:
Sat. Fat
18.867 g
Monounsaturated fat:
Mono. Fat
9.246 g
Polyunsaturated fat:
Poly. Fat
1.421 g
Contains
less
Sat. Fat Saturated fat
-99.5%
Contains
more
Mono. Fat Monounsaturated fat
+6504.3%
Contains
more
Poly. Fat Polyunsaturated fat
+1901.4%
Carbohydrate type comparison
Carbohydrate type breakdown side-by-side comparison
3
51%
15%
34%
Starch:
0 g
Sucrose:
6.97 g
Glucose:
2.01 g
Fructose:
4.68 g
Lactose:
0 g
Maltose:
0 g
Galactose:
0 g
2
54%
25%
21%
Starch:
0 g
Sucrose:
0 g
Glucose:
0.26 g
Fructose:
0 g
Lactose:
0.12 g
Maltose:
0 g
Galactose:
0.1 g
Contains
more
Sucrose Sucrose
+∞%
Contains
more
Glucose Glucose
+673.1%
Contains
more
Fructose Fructose
+∞%
Contains
more
Lactose Lactose
+∞%
Contains
more
Galactose Galactose
+∞%
~equal in
Starch
~0g
~equal in
Maltose
~0g