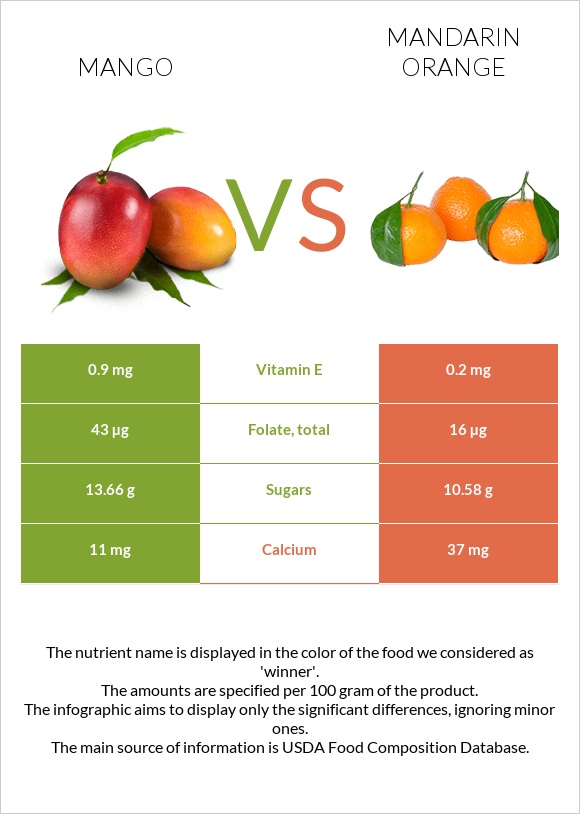
Mango vs. Mandarin orange — Health Impact and Nutrition Comparison


Summary
Mangoes originate from South Asia but are now grown in many tropical and subtropical regions worldwide. Mandarin oranges, also known as mandarins or tangerines, are native to China but are cultivated in many parts of the world, especially in Asia and the Mediterranean region.
Mangoes have a sweet and tropical flavor with hints of peach, pineapple, and citrus. When ripe, they have a juicy and smooth texture. Mandarin oranges have a sweet and tangy flavor with citrus undertones. They are usually less juicy than mangoes and have a firmer texture.
Mangoes are rich in vitamins A and C, as well as antioxidants like beta-carotene and polyphenols. Mandarin oranges are also high in vitamin C and contain smaller amounts of other vitamins and minerals, such as vitamin A, potassium, and calcium.
Table of contents
Introduction
Mangoes and mandarin oranges are two distinct fruits that offer unique flavors, appearances, and culinary uses. Both are beloved for their sweet taste and versatility in various dishes and beverages. Let's explore their classifications, appearances, tastes, and common uses to understand their individual characteristics better.
Nutrition
The infographics on this page display nutritional information for 100 g servings of raw mango and raw mandarin oranges.
The average serving size for mango and mandarin oranges is 165 g and 195 g, respectively.
It's important to note that these serving sizes are standard amounts, not recommendations.
Macronutrients and Calories
Mango and mandarin oranges share a similar macronutrient composition, but mango is slightly denser. Mango consists of 83% water, 15% carbohydrates, and 2% other nutrients, while mandarin oranges contain 85% water, 13% carbohydrates, and 2% other nutrients.
In terms of calories, mandarin oranges are lower in calories than mangoes, with 53 kcal per 100 g for mandarin oranges and 60 kcal for mangoes.
Macronutrient Comparison
Contains
more
FatsFats
+22.6%
Contains
more
CarbsCarbs
+12.3%
Protein
When we compare the protein content of mangoes and mandarin oranges, we find that mangoes contain about 0.82 grams of protein per 100 grams. In comparison, mandarin oranges contain about 0.81 grams of protein per 100 grams.
Therefore, mangoes have a slightly higher protein content than mandarin oranges on a per-100-gram basis.
It's important to note that both fruits are not particularly rich protein sources compared to other food types, such as meats, legumes, or dairy products.
Fats
When comparing the fat content of mangoes and mandarin oranges, we find that mangoes contain about 0.4 grams of fat per 100 grams, while mandarin oranges contain about 0.3 grams of fat per 100 grams.
Thus, mandarin oranges have a slightly lower fat content than mangoes on a per-100-gram basis.
Both fruits are generally low in fat and are primarily valued for their vitamins, minerals, and carbohydrates rather than their fat content.
Fat Type Comparison
Contains
more
Mono. FatMonounsaturated fat
+133.3%
Contains
less
Sat. FatSaturated fat
-57.6%
Carbohydrates
Here's a comparison of the carbohydrate content, net carbs, and dietary fiber for mangoes and mandarin oranges per 100 grams:
Mango:
- Total Carbohydrates: 15 grams
- Net Carbs: approximately 13.4 grams
- Dietary Fiber: approximately 1.6 grams
Mandarin orange:
- Total Carbohydrates: 13.3 grams
- Net Carbs: approximately 11.5 grams
- Dietary Fiber: approximately 1.8 grams
Therefore, mangoes have a slightly higher carbohydrate content compared to mandarin oranges on a per-100-gram basis.
Net carbs represent the total carbohydrates minus the dietary fiber content. Both mangoes and mandarin oranges are relatively low in net carbs, with mandarin oranges having a slightly lower net carb content compared to mangoes per 100 grams due to their slightly higher fiber content. However, both fruits provide a good source of dietary fiber, which benefits digestion and overall health.
Carbohydrate type comparison
Contains
more
SucroseSucrose
+15.2%
Contains
more
FructoseFructose
+95%
Vitamins
100 grams of mangoes provide about 40% of the daily value (DV) of vitamin C, while mandarin oranges contribute approximately 30% of the DV.
In terms of vitamin A content, mangoes contain roughly 6% DV, and mandarin oranges offer about 4% DV. Additionally, mangoes provide approximately 11% DV of folate and 7% DV of vitamin B6, while mandarin oranges supply about 4% DV of vitamin A and 5% DV of folate.
More information about the vitamin content of these fruits can be found in the chart below on this page.
Vitamin Comparison
Contains
more
Vitamin CVitamin C
+36.3%
Contains
more
Vitamin AVitamin A
+58.8%
Contains
more
Vitamin EVitamin E
+350%
Contains
more
Vitamin B3Vitamin B3
+77.9%
Contains
more
Vitamin B6Vitamin B6
+52.6%
Contains
more
Vitamin KVitamin K
+∞%
Contains
more
FolateFolate
+168.8%
Contains
more
Vitamin B1Vitamin B1
+107.1%
Minerals
Mandarin oranges typically contain slightly higher amounts of calcium and phosphorus compared to mangoes per 100 grams. However, neither fruit is considered a significant source of minerals when compared to other types of food.
For more information about the mineral content of these fruits, please refer to the chart below on this page.
Mineral Comparison
Contains
more
CopperCopper
+164.3%
Contains
more
ZincZinc
+28.6%
Contains
less
SodiumSodium
-50%
Contains
more
ManganeseManganese
+61.5%
Contains
more
SeleniumSelenium
+500%
Contains
more
MagnesiumMagnesium
+20%
Contains
more
CalciumCalcium
+236.4%
Contains
more
PhosphorusPhosphorus
+42.9%
Glycemic Index & Load
The glycemic index (GI) and glycemic load (GL) of foods can provide insights into how they affect blood sugar levels. Here's a comparison of the glycemic index and load for mangoes and mandarin oranges:
Glycemic Index
Mangoes: The GI of mangoes is considered to be medium to high, typically ranging from 51 to 60, depending on factors such as ripeness and variety.
Mandarin Oranges: The GI of mandarin oranges is lower compared to mangoes, usually ranging from 31 to 47.
Glycemic Load
Mangoes: The glycemic load of mangoes varies depending on serving size and ripeness but is generally considered moderate, typically ranging from 8 to 14 for a standard serving size.
Mandarin Oranges: Mandarin oranges tend to have a lower glycemic load compared to mangoes, with values ranging from 4 to 7 for a standard serving size.
In summary, mandarin oranges generally have a lower glycemic index and load compared to mangoes, making them a better choice for individuals concerned about blood sugar control. However, both fruits can be enjoyed in moderation as part of a balanced diet.
Weight Loss & Diets
Both mangoes and mandarin oranges can be beneficial additions to weight loss and various diets due to their nutritional profiles. Let's explore how they might fit into different types of diets:
Low-Calorie Diet: Both mangoes and mandarin oranges are relatively low in calories compared to many other foods, making them suitable choices for a low-calorie diet aimed at weight loss. They can add sweetness and flavor to meals and snacks without significantly increasing calorie intake.
Low-Carb Diet (e.g., Keto, Atkins): While mangoes and mandarin oranges contain natural sugars and carbohydrates, they can still be included in moderation in a low-carb diet, especially during phases where carbohydrate intake is less restricted. However, individuals following strict low-carb diets may prefer to limit their consumption of these fruits due to their carbohydrate content.
Mediterranean Diet: Both mangoes and mandarin oranges align well with the Mediterranean diet, which emphasizes whole, minimally processed foods, including fruits, vegetables, nuts, seeds, whole grains, and healthy fats. These fruits can contribute to the diet's overall nutrient diversity and provide natural sweetness.
Paleo Diet: Mangoes and mandarin oranges are both considered paleo-friendly fruits. The Paleo diet encourages the consumption of whole, unprocessed foods that would have been available to our Paleolithic ancestors. Both fruits can be enjoyed in moderation as part of a Paleo diet.
Vegetarian or Vegan Diet: Mangoes and mandarin oranges are plant-based foods suitable for vegetarian and vegan diets. They provide essential vitamins, minerals, and antioxidants, making them valuable components of a plant-based eating plan.
Gluten-Free Diet: Mangoes and mandarin oranges are naturally gluten-free, making them safe options for individuals with celiac disease or gluten sensitivity. They can add variety and nutritional value to a gluten-free diet.
In conclusion, mangoes and mandarin oranges can be included in a wide range of diets, from low-calorie to plant-based, due to their nutrient density, relatively low-calorie content, and versatility in meal planning. However, portion control and overall dietary balance remain important considerations for weight loss and overall health.
Health Impact
Cardiovascular Health
Both mangoes and mandarin oranges are good sources of dietary fiber, which can help lower cholesterol levels and reduce cardiovascular risk.
Increasing dietary fiber intake can serve as a dietary strategy alongside statin medication to lower both total cholesterol and LDL (“bad” cholesterol) levels. This approach not only aids in reducing the required dose of statins but also mitigates their side effects. Given the substantial fiber content present in fruits like mangoes and mandarin oranges, incorporating them into one's diet becomes an appealing method for preventing diseases and lowering the risk of atherosclerosis, the main cause of coronary heart disease (1).
Additionally, based on this study, compounds isolated from tangerine peels have demonstrated potential as a natural alternative for reducing LDL cholesterol without the potential side effects associated with conventional cholesterol-lowering drugs (2).
Mangoes are well-known for their high vitamin C content, which is an antioxidant that helps protect the cardiovascular system by reducing oxidative stress and inflammation. Mandarin oranges also contain vitamin C, although in slightly lower amounts compared to mangoes.
Both of these fruits also contain other antioxidants, and small amounts of vitamin E. Studies have shown that vitamin E may reduce the risk of atherosclerotic plaque formation (3).
In this study, it was found that consuming 280g of mangos daily for 8 weeks resulted in a 3.5% reduction in systolic blood pressure (4). Mandarin oranges can also help lower blood pressure because they are rich in potassium and magnesium. However, it is important to consume them as part of a balanced diet and lifestyle for optimal cardiovascular health.
In summary, both mangoes and mandarin oranges can be part of a heart-healthy diet due to their rich nutrient content, including fiber, vitamins, minerals, and antioxidants. However, portion control and overall dietary balance are important factors to consider, especially for individuals with specific health concerns such as diabetes or obesity.
Diabetes mellitus
For patients with diabetes mellitus, understanding how different fruits affect insulin levels can be crucial. Here's a comparison of mandarin oranges and mangoes in terms of their impact on insulin:
- Glycemic Index (GI) and Insulin Response:
Mandarin oranges have a low glycemic index (GI), meaning they cause a slower and more gradual increase in blood sugar levels. This slower rise in blood sugar typically requires a more moderate release of insulin, helping to avoid spikes.
Mangoes have a medium to high GI, leading to a quicker increase in blood sugar levels. Consequently, they may trigger a more significant release of insulin to manage the elevated glucose levels.
- Fiber Content and Insulin Sensitivity:
Mandarin oranges are rich in fiber, which can improve insulin sensitivity. Fiber slows down the absorption of sugars, reducing the demand for insulin and helping to maintain stable blood sugar levels.
Mangoes also contain fiber, albeit in slightly lower amounts compared to mandarin oranges. However, this fiber content can still contribute to better insulin sensitivity and blood sugar management.
- Fructose Content:
Both mandarin oranges and mangoes contain natural sugars, primarily fructose. Fructose metabolism differs from glucose metabolism and may have a different impact on insulin levels. However, the total amount of fructose consumed from these fruits is generally not a concern for most people with diabetes when consumed in moderation.
- Overall Nutrient Profile:
Both fruits offer essential nutrients, including vitamins, minerals, and antioxidants, which can support overall health. These nutrients can contribute to better insulin sensitivity and glucose metabolism.
In summary, while both mandarin oranges and mangoes can be included in a diabetes-friendly diet, mandarin oranges may have a slightly lower impact on insulin levels due to their lower GI and higher fiber content. However, portion control and overall carbohydrate intake remain important factors for managing blood sugar levels effectively. As always, individuals with diabetes should monitor their blood sugar levels closely and consult with healthcare professionals for personalized dietary guidance.
Digestion
Both mandarin oranges and mangoes are fruits that can be included in a digestive-friendly diet, but there are some differences to consider.
Fiber Content: As mentioned above, mangoes generally have less fiber than mandarin oranges. Dietary fiber is crucial for digestion as it promotes regular bowel movements, supports beneficial gut bacteria, and helps in maintaining a healthy weight.
It's important to note that there is limited evidence to recommend a specific dietary approach for Crohn's disease (CD), especially regarding fiber intake. The safe fiber intake range for CD patients is 13.4-33.4 grams per day. Higher fiber intake may help maintain remission along with conventional therapies, but more studies are needed to determine the optimal amount and type of fiber for improving remission rates (5).
Fructose Content: Mangoes are relatively high in fructose, a type of sugar that can cause digestive discomfort in some individuals, particularly those with fructose malabsorption. Mandarin oranges, on the other hand, have a lower fructose content and may be better tolerated by some people with this condition.
It should be noted that if you have specific digestive issues, it's always a good idea to consult with a healthcare professional or a registered dietitian who can provide personalized advice tailored to your needs.
Cancer
Both mangoes and mandarin oranges contain nutrients and antioxidants that may help reduce the risk of cancer. They're rich in vitamins, particularly vitamin C, and antioxidants like beta-carotene and flavonoids, which can neutralize harmful free radicals in the body. However, no single food can prevent or cure cancer, so it's important to maintain a balanced diet and a healthy lifestyle overall (6).
These findings indicate that regularly eating raw vegetables, persimmons, and tangerines might lower the risk of thyroid cancer and potentially prevent its early stages (7).
Immune System
Mangoes and mandarin oranges are both rich in vitamin C, a crucial nutrient that enhances the immune system by strengthening the body's ability to fight off infections.
Skin Health
Mangoes and mandarin oranges are rich in vitamin C and contain vitamin A, both of which are important for skin health. Vitamin C promotes collagen production for firm, youthful skin while also protecting the skin from oxidative damage by free radicals. On the other hand, vitamin A supports skin cell turnover and repair (8, 9).
Classification and Appearance
Mango belongs to the genus Mangifera, and there are several varieties cultivated worldwide. It typically features an oval or slightly rounded shape with a smooth, sometimes waxy skin that can range from green to yellow, orange, or red when ripe. The flesh is juicy, fibrous, and varies from yellow-orange to deep orange, surrounding a large, flat seed.
Mandarin orange is a citrus fruit classified under the genus Citrus. It is smaller compared to other citrus fruits and is easy to peel due to its loose skin. Mandarin oranges are typically round or slightly flattened, with a bright orange, smooth, and glossy peel. The segments inside are easily separable and are usually seedless.
Taste and Use
Mangoes are renowned for their lusciously sweet flavor with tropical notes and a hint of acidity. They are enjoyed fresh as a standalone snack, in fruit salads, smoothies, desserts like mango sticky rice, and savory dishes such as salads, salsas, and chutneys. Mangoes can also be dried, pickled, or processed into jams, juices, and sauces.
Mandarin oranges offer a sweet and tangy flavor with a refreshing citrus aroma. They are commonly consumed fresh as a quick and convenient snack due to their easy-to-peel nature. Mandarin oranges are also used in salads, desserts, and savory dishes, adding a burst of citrusy flavor. Additionally, their juice is popular for beverages and cocktails, and they are frequently canned or preserved for extended shelf life.
Sources
- https://www.ncbi.nlm.nih.gov/pmc/articles/PMC6566984/
- https://www.sciencedaily.com/releases/2004/05/040512041238.htm
- https://www.sciencedirect.com/science/article/pii/S0022316622146390
- https://pubmed.ncbi.nlm.nih.gov/35506190/
- https://www.ncbi.nlm.nih.gov/pmc/articles/PMC10384554/
- https://pubmed.ncbi.nlm.nih.gov/32506936/
- https://pubmed.ncbi.nlm.nih.gov/22455656/
- https://www.researchgate.net/publication/242079025_Effect_of_vitamin_C_on_collagen_biosynthesis_and_degree_of_birefringence_in_polarization_sensitive_optical_coherence_tomography_PS-OCT
- https://www.ncbi.nlm.nih.gov/pmc/articles/PMC4642156/

Infographic
All nutrients comparison - raw data values
| Nutrient | |
|
DV% diff. |
| Vitamin C | 36.4mg | 26.7mg | 11% |
| Copper | 0.111mg | 0.042mg | 8% |
| Folate | 43µg | 16µg | 7% |
| Vitamin E | 0.9mg | 0.2mg | 5% |
| Vitamin K | 4.2µg | 0µg | 4% |
| Calcium | 11mg | 37mg | 3% |
| Vitamin B1 | 0.028mg | 0.058mg | 3% |
| Vitamin B6 | 0.119mg | 0.078mg | 3% |
| Fructose | 4.68g | 2.4g | 3% |
| Vitamin A | 54µg | 34µg | 2% |
| Vitamin B3 | 0.669mg | 0.376mg | 2% |
| Carbs | 14.98g | 13.34g | 1% |
| Fiber | 1.6g | 1.8g | 1% |
| Phosphorus | 14mg | 20mg | 1% |
| Manganese | 0.063mg | 0.039mg | 1% |
| Selenium | 0.6µg | 0.1µg | 1% |
| Calories | 60kcal | 53kcal | 0% |
| Protein | 0.82g | 0.81g | 0% |
| Protein per 100 calories | 1.4g | 1.5g | N/A |
| Calories per 10 g protein | 732kcal | 654kcal | N/A |
| Weight per 100 calories | 167g | 189g | N/A |
| Fats | 0.38g | 0.31g | 0% |
| Net carbs | 13.38g | 11.54g | N/A |
| Magnesium | 10mg | 12mg | 0% |
| Potassium | 168mg | 166mg | 0% |
| Iron | 0.16mg | 0.15mg | 0% |
| Sugar | 13.66g | 10.58g | N/A |
| Zinc | 0.09mg | 0.07mg | 0% |
| Sodium | 1mg | 2mg | 0% |
| Vitamin B2 | 0.038mg | 0.036mg | 0% |
| Vitamin B5 | 0.197mg | 0.216mg | 0% |
| Choline | 7.6mg | 10.2mg | 0% |
| Saturated fat | 0.092g | 0.039g | 0% |
| Monounsaturated fat | 0.14g | 0.06g | 0% |
| Polyunsaturated fat | 0.071g | 0.065g | 0% |
| Tryptophan | 0.013mg | 0.002mg | 0% |
| Threonine | 0.031mg | 0.016mg | 0% |
| Isoleucine | 0.029mg | 0.017mg | 0% |
| Leucine | 0.05mg | 0.028mg | 0% |
| Lysine | 0.066mg | 0.032mg | 0% |
| Methionine | 0.008mg | 0.002mg | 0% |
| Phenylalanine | 0.027mg | 0.018mg | 0% |
| Valine | 0.042mg | 0.021mg | 0% |
| Histidine | 0.019mg | 0.011mg | 0% |
People also compare


References
All the values for which the sources are not specified explicitly are taken from FDA’s Food Central. The exact link to the food presented on this page can be found below.
- Mango - https://fdc.nal.usda.gov/fdc-app.html#/food-details/169910/nutrients
- Mandarin orange - https://fdc.nal.usda.gov/fdc-app.html#/food-details/169105/nutrients
All the Daily Values are presented for males aged 31-50, for 2000-calorie diets.