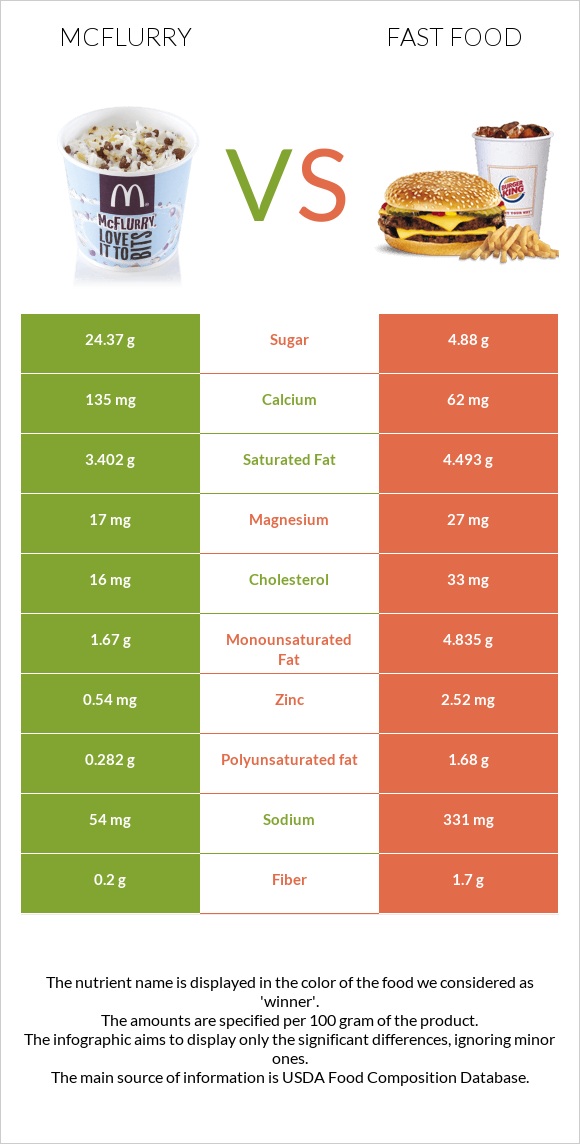
A recap on the differences between mcFlurry and fast food Fast food is higher than mcFlurry in iron, vitamin B3, vitamin B1, folate, zinc, manganese, vitamin B6, vitamin B12, and vitamin B2. Fast food covers your daily iron needs 35% more than mcFlurry. The amount of sodium in mcFlurry is lower. Food varieties used in this article are McDONALD'S, McFLURRY with M&M'S CANDIES and Fast foods, hamburger; single, regular patty; plain .
Infographic
Mineral Comparison
Mineral comparison score is based on the number of minerals by which one or the other food is richer. The "coverage" charts below show how much of the daily needs can be covered by 300 grams of the food.
2
100 g
300 g
1 regular (12 fl oz) - 348g 1 large (16 fl oz) - 504g
Magnesium
Magnesium
Calcium
Calcium
Potassium
Potassium
Iron
Iron
Copper
Copper
Zinc
Zinc
Phosphorus
Phosphorus
Sodium
Sodium
Manganese
Manganese
Selenium
Selenium
12%
41%
18%
10%
15%
15%
50%
7%
6%
0%
7
100 g
300 g
1 sandwich - 78g
Magnesium
Magnesium
Calcium
Calcium
Potassium
Potassium
Iron
Iron
Copper
Copper
Zinc
Zinc
Phosphorus
Phosphorus
Sodium
Sodium
Manganese
Manganese
Selenium
Selenium
19%
19%
17%
115%
40%
69%
57%
43%
47%
111%
Vitamin Comparison
Vitamin comparison score is based on the number of vitamins by which one or the other food is richer. The "coverage" charts below show how much of the daily needs can be covered by 300 grams of the food.
1
100 g
300 g
1 regular (12 fl oz) - 348g 1 large (16 fl oz) - 504g
Vitamin C
Vit. C
Vitamin D
Vit. D
Vitamin A
Vit. A
Vitamin E
Vit. E
Vitamin B1
Vit. B1
Vitamin B2
Vit. B2
Vitamin B3
Vit. B3
Vitamin B5
Vit. B5
Vitamin B6
Vit. B6
Vitamin B12
Vit. B12
Vitamin K
Vit. K
Folate
Folate
0%
0%
0%
1.6%
13%
56%
2.6%
44%
12%
75%
0%
2.3%
10
100 g
300 g
1 sandwich - 78g
Vitamin C
Vit. C
Vitamin D
Vit. D
Vitamin A
Vit. A
Vitamin E
Vit. E
Vitamin B1
Vit. B1
Vitamin B2
Vit. B2
Vitamin B3
Vit. B3
Vitamin B5
Vit. B5
Vitamin B6
Vit. B6
Vitamin B12
Vit. B12
Vitamin K
Vit. K
Folate
Folate
0%
1.5%
3%
7.6%
79%
84%
105%
32%
49%
111%
12%
60%
All nutrients comparison - raw data values
Nutrient
DV% diff.
Selenium
20.3µg
37%
Iron
0.27mg
3.06mg
35%
Vitamin B3
0.139mg
5.617mg
34%
Protein
4.02g
16.52g
25%
Vitamin B1
0.051mg
0.317mg
22%
Folate
3µg
80µg
19%
Zinc
0.54mg
2.52mg
18%
Manganese
0.046mg
0.357mg
14%
Sodium
54mg
331mg
12%
Vitamin B6
0.053mg
0.212mg
12%
Vitamin B12
0.6µg
0.89µg
12%
Fats
6.46g
12.01g
9%
Copper
0.044mg
0.121mg
9%
Starch
22.87g
9%
Vitamin B2
0.243mg
0.363mg
9%
Polyunsaturated fat
0.282g
1.68g
9%
Monounsaturated fat
1.67g
4.835g
8%
Calcium
135mg
62mg
7%
Calories
177kcal
297kcal
6%
Cholesterol
16mg
33mg
6%
Fiber
0.2g
1.7g
6%
Choline
34.4mg
6%
Saturated fat
3.402g
4.493g
5%
Vitamin B5
0.73mg
0.53mg
4%
Vitamin K
4.9µg
4%
Phosphorus
116mg
134mg
3%
Fructose
0.21g
2.27g
3%
Carbs
26.82g
31.5g
2%
Magnesium
17mg
27mg
2%
Vitamin E
0.08mg
0.38mg
2%
Vitamin D
0.1µg
1%
Vitamin A
9µg
1%
Protein per 100 calories
2.3g
5.6g
N/A
Calories per 10 g protein
440kcal
180kcal
N/A
Weight per 100 calories
56g
34g
N/A
Unsaturated / Saturated Fat ratio
0.57
1.5
N/A
Net carbs
26.62g
29.8g
N/A
Vitamin D*
2 IU
0%
Potassium
208mg
197mg
0%
Sugar
24.37g
4.88g
N/A
Trans fat
0.281g
0.514g
N/A
Tryptophan
0.144mg
0%
Threonine
0.46mg
0%
Isoleucine
0.642mg
0%
Leucine
1.13mg
0%
Lysine
0.785mg
0%
Methionine
0.306mg
0%
Phenylalanine
0.67mg
0%
Valine
0.728mg
0%
Histidine
0.402mg
0%
Omega-3 - EPA
0.005g
N/A
Omega-3 - DHA
0.001g
N/A
Omega-3 - ALA
0.121g
N/A
Omega-3 - DPA
0.009g
N/A
Omega-6 - Gamma-linoleic acid
0.004g
N/A
Omega-6 - Dihomo-gamma-linoleic acid
0.009g
N/A
Omega-6 - Eicosadienoic acid
0g
0.003g
N/A
Omega-6 - Linoleic acid
1.391g
N/A
Macronutrient Comparison
Macronutrient breakdown side-by-side comparison
1
4%
6%
27%
62%
Protein:
4.02 g
Fats:
6.46 g
Carbs:
26.82 g
Water:
61.74 g
Other:
0.96 g
4
17%
12%
32%
38%
Protein:
16.52 g
Fats:
12.01 g
Carbs:
31.5 g
Water:
38.45 g
Other:
1.52 g
Contains
more
Water Water
+60.6%
Contains
more
Protein Protein
+310.9%
Contains
more
Fats Fats
+85.9%
Contains
more
Carbs Carbs
+17.4%
Contains
more
Other Other
+58.3%
Fat Type Comparison
Fat type breakdown side-by-side comparison
1
64%
31%
5%
Saturated fat:
Sat. Fat
3.402 g
Monounsaturated fat:
Mono. Fat
1.67 g
Polyunsaturated fat:
Poly. Fat
0.282 g
2
41%
44%
15%
Saturated fat:
Sat. Fat
4.493 g
Monounsaturated fat:
Mono. Fat
4.835 g
Polyunsaturated fat:
Poly. Fat
1.68 g
Contains
less
Sat. Fat Saturated fat
-24.3%
Contains
more
Mono. Fat Monounsaturated fat
+189.5%
Contains
more
Poly. Fat Polyunsaturated fat
+495.7%
Carbohydrate type comparison
Carbohydrate type breakdown side-by-side comparison
2
69%
3%
26%
Starch:
0 g
Sucrose:
16.9 g
Glucose:
0.75 g
Fructose:
0.21 g
Lactose:
6.23 g
Maltose:
0.28 g
Galactose:
0 g
4
82%
7%
8%
2%
Starch:
22.87 g
Sucrose:
0 g
Glucose:
2.05 g
Fructose:
2.27 g
Lactose:
0 g
Maltose:
0.57 g
Galactose:
0 g
Contains
more
Sucrose Sucrose
+∞%
Contains
more
Lactose Lactose
+∞%
Contains
more
Starch Starch
+∞%
Contains
more
Glucose Glucose
+173.3%
Contains
more
Fructose Fructose
+981%
Contains
more
Maltose Maltose
+103.6%