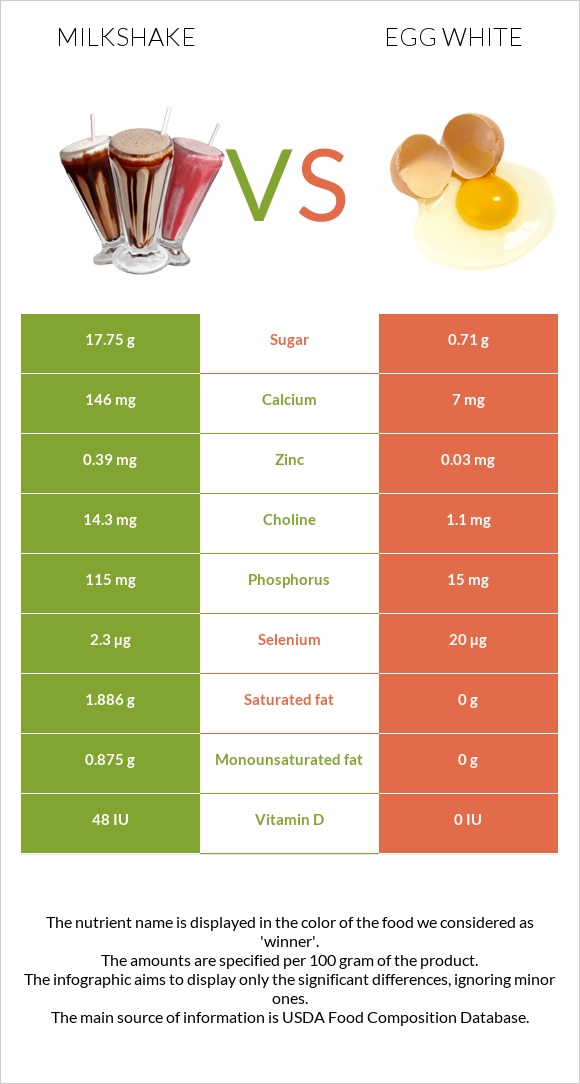
A recap on the differences between milkshake and egg whites Milkshake has more vitamin B12, phosphorus, calcium, vitamin D* and monounsaturated fat; however, egg whites are higher in selenium and vitamin B2. Egg whites cover your daily selenium needs 32% more than milkshake. The glycemic index of milkshake is higher. Food varieties used in this article are Milk shakes, thick vanilla and Egg, white, raw, fresh .
Infographic
Mineral Comparison
Mineral comparison score is based on the number of minerals by which one or the other food is richer. The "coverage" charts below show how much of the daily needs can be covered by 300 grams of the food.
8
100 g
300 g
1 fl oz - 28.4g 1 container (11 oz) - 313g
Magnesium
Magnesium
Calcium
Calcium
Potassium
Potassium
Iron
Iron
Copper
Copper
Zinc
Zinc
Phosphorus
Phosphorus
Sodium
Sodium
Manganese
Manganese
Selenium
Selenium
8.6%
44%
16%
3.8%
17%
11%
49%
12%
1.8%
13%
1
100 g
300 g
1 large - 33g 1 cup - 243g
Magnesium
Magnesium
Calcium
Calcium
Potassium
Potassium
Iron
Iron
Copper
Copper
Zinc
Zinc
Phosphorus
Phosphorus
Sodium
Sodium
Manganese
Manganese
Selenium
Selenium
7.9%
2.1%
14%
3%
7.7%
0.82%
6.4%
22%
1.4%
109%
Vitamin Comparison
Vitamin comparison score is based on the number of vitamins by which one or the other food is richer. The "coverage" charts below show how much of the daily needs can be covered by 300 grams of the food.
10
100 g
300 g
1 fl oz - 28.4g 1 container (11 oz) - 313g
Vitamin C
Vit. C
Vitamin D
Vit. D
Vitamin A
Vit. A
Vitamin E
Vit. E
Vitamin B1
Vit. B1
Vitamin B2
Vit. B2
Vitamin B3
Vit. B3
Vitamin B5
Vit. B5
Vitamin B6
Vit. B6
Vitamin B12
Vit. B12
Vitamin K
Vit. K
Folate
Folate
0%
18%
8.3%
1%
7.5%
45%
2.7%
22%
9.7%
65%
0.5%
5.3%
1
100 g
300 g
1 large - 33g 1 cup - 243g
Vitamin C
Vit. C
Vitamin D
Vit. D
Vitamin A
Vit. A
Vitamin E
Vit. E
Vitamin B1
Vit. B1
Vitamin B2
Vit. B2
Vitamin B3
Vit. B3
Vitamin B5
Vit. B5
Vitamin B6
Vit. B6
Vitamin B12
Vit. B12
Vitamin K
Vit. K
Folate
Folate
0%
0%
0%
0%
1%
101%
2%
11%
1.2%
11%
0%
3%
All nutrients comparison - raw data values
Nutrient
DV% diff.
Selenium
2.3µg
20µg
32%
Vitamin B2
0.195mg
0.439mg
19%
Vitamin B12
0.52µg
0.09µg
18%
Protein
3.86g
10.9g
14%
Calcium
146mg
7mg
14%
Phosphorus
115mg
15mg
14%
Saturated fat
1.886g
0g
9%
Carbs
17.75g
0.73g
6%
Vitamin D*
48 IU
0 IU
6%
Vitamin D
1.2µg
0µg
6%
Fats
3.03g
0.17g
4%
Cholesterol
12mg
0mg
4%
Vitamin B5
0.368mg
0.19mg
4%
Calories
112kcal
52kcal
3%
Copper
0.051mg
0.023mg
3%
Zinc
0.39mg
0.03mg
3%
Sodium
95mg
166mg
3%
Vitamin A
25µg
0µg
3%
Vitamin B6
0.042mg
0.005mg
3%
Vitamin B1
0.03mg
0.004mg
2%
Choline
14.3mg
1.1mg
2%
Monounsaturated fat
0.875g
0g
2%
Potassium
183mg
163mg
1%
Folate
7µg
4µg
1%
Polyunsaturated fat
0.113g
0g
1%
Protein per 100 calories
3.4g
21g
N/A
Calories per 10 g protein
290kcal
48kcal
N/A
Weight per 100 calories
89g
192g
N/A
Unsaturated / Saturated Fat ratio
0.52
N/A
Net carbs
17.75g
0.73g
N/A
Magnesium
12mg
11mg
0%
Iron
0.1mg
0.08mg
0%
Sugar
17.75g
0.71g
N/A
Vitamin E
0.05mg
0mg
0%
Manganese
0.014mg
0.011mg
0%
Vitamin B3
0.146mg
0.105mg
0%
Vitamin K
0.2µg
0µg
0%
Tryptophan
0.054mg
0.125mg
0%
Threonine
0.174mg
0.449mg
0%
Isoleucine
0.234mg
0.661mg
0%
Leucine
0.378mg
1.016mg
0%
Lysine
0.306mg
0.806mg
0%
Methionine
0.097mg
0.399mg
0%
Phenylalanine
0.186mg
0.686mg
0%
Valine
0.258mg
0.809mg
0%
Histidine
0.105mg
0.29mg
0%
Fructose
0.07g
0%
Macronutrient Comparison
Macronutrient breakdown side-by-side comparison
3
4%
3%
18%
74%
Protein:
3.86 g
Fats:
3.03 g
Carbs:
17.75 g
Water:
74.45 g
Other:
0.91 g
2
11%
88%
Protein:
10.9 g
Fats:
0.17 g
Carbs:
0.73 g
Water:
87.57 g
Other:
0.63 g
Contains
more
Fats Fats
+1682.4%
Contains
more
Carbs Carbs
+2331.5%
Contains
more
Other Other
+44.4%
Contains
more
Protein Protein
+182.4%
Contains
more
Water Water
+17.6%