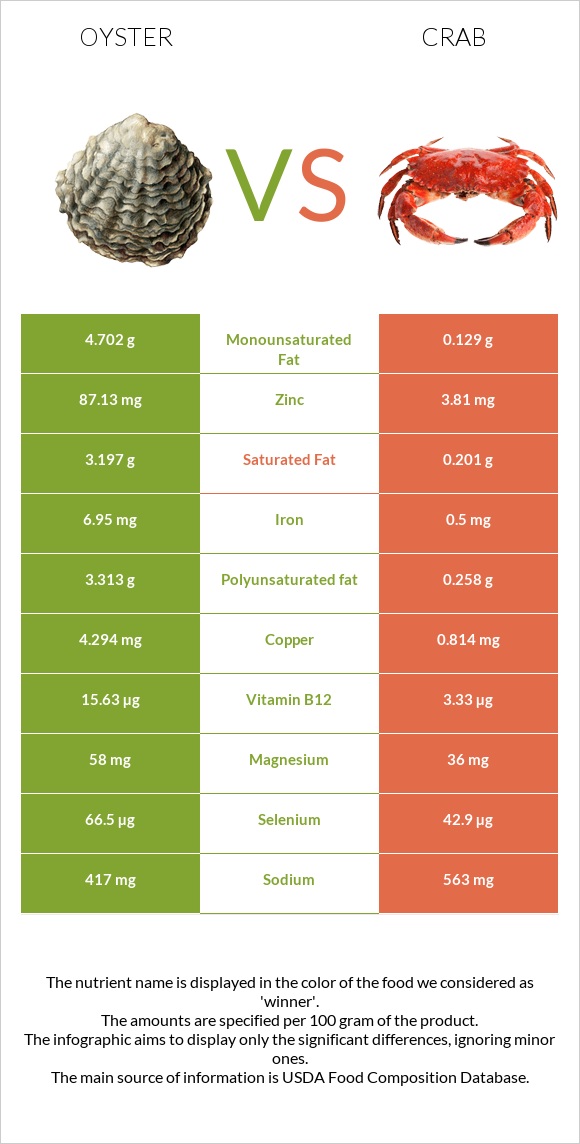
Significant differences between oysters and crab Oysters has more zinc, vitamin B12, copper, iron, manganese, and choline; however, crab is richer in vitamin B5, folate, and vitamin B6. Oysters covers your daily zinc needs 680% more than crab. Crab has 18 times less iron than oysters. Oysters has 9.21mg of iron, while crab has 0.5mg. Oysters contains less sodium. Specific food types used in this comparison are Mollusks, oyster, eastern, wild, cooked, moist heat and Crustaceans, crab, blue, canned .
Infographic
Mineral Comparison
Mineral comparison score is based on the number of minerals by which one or the other food is richer. The "coverage" charts below show how much of the daily needs can be covered by 300 grams of the food.
6
100 g
300 g
6 medium - 42g 3 oz - 85g
Magnesium
Magnesium
Calcium
Calcium
Potassium
Potassium
Iron
Iron
Copper
Copper
Zinc
Zinc
Phosphorus
Phosphorus
Sodium
Sodium
Manganese
Manganese
Selenium
Selenium
25%
35%
12%
345%
1902%
2144%
83%
22%
77%
215%
2
100 g
300 g
1 oz - 28.35g 3 oz - 85g 1 can (6.5 oz), drained - 125g 1 cup - 135g
Magnesium
Magnesium
Calcium
Calcium
Potassium
Potassium
Iron
Iron
Copper
Copper
Zinc
Zinc
Phosphorus
Phosphorus
Sodium
Sodium
Manganese
Manganese
Selenium
Selenium
26%
27%
23%
19%
271%
104%
100%
73%
9.7%
234%
Vitamin Comparison
Vitamin comparison score is based on the number of vitamins by which one or the other food is richer. The "coverage" charts below show how much of the daily needs can be covered by 300 grams of the food.
5
100 g
300 g
6 medium - 42g 3 oz - 85g
Vitamin C
Vit. C
Vitamin D
Vit. D
Vitamin A
Vit. A
Vitamin E
Vit. E
Vitamin B1
Vit. B1
Vitamin B2
Vit. B2
Vitamin B3
Vit. B3
Vitamin B5
Vit. B5
Vitamin B6
Vit. B6
Vitamin B12
Vit. B12
Vitamin K
Vit. K
Folate
Folate
0%
0%
8.7%
34%
9%
42%
35%
27%
14%
2188%
5%
11%
5
100 g
300 g
1 oz - 28.35g 3 oz - 85g 1 can (6.5 oz), drained - 125g 1 cup - 135g
Vitamin C
Vit. C
Vitamin D
Vit. D
Vitamin A
Vit. A
Vitamin E
Vit. E
Vitamin B1
Vit. B1
Vitamin B2
Vit. B2
Vitamin B3
Vit. B3
Vitamin B5
Vit. B5
Vitamin B6
Vit. B6
Vitamin B12
Vit. B12
Vitamin K
Vit. K
Folate
Folate
11%
0%
0.33%
37%
5.8%
21%
52%
60%
36%
416%
0.75%
38%
All nutrients comparison - raw data values
Nutrient
DV% diff.
Zinc
78.6mg
3.81mg
680%
Vitamin B12
17.5µg
3.33µg
590%
Copper
5.707mg
0.814mg
544%
Iron
9.21mg
0.5mg
109%
Manganese
0.591mg
0.074mg
22%
Sodium
166mg
563mg
17%
Protein
11.42g
17.88g
13%
Vitamin B5
0.447mg
0.997mg
11%
Folate
14µg
51µg
9%
Choline
130mg
80.9mg
9%
Vitamin B2
0.18mg
0.093mg
7%
Vitamin B6
0.061mg
0.156mg
7%
Cholesterol
79mg
97mg
6%
Phosphorus
194mg
234mg
6%
Selenium
39.5µg
42.9µg
6%
Vitamin B3
1.85mg
2.747mg
6%
Polyunsaturated fat
1.056g
0.258g
5%
Fats
3.42g
0.74g
4%
Vitamin C
0mg
3.3mg
4%
Potassium
139mg
259mg
4%
Calcium
116mg
91mg
3%
Vitamin A
26µg
1µg
3%
Saturated fat
0.948g
0.201g
3%
Carbs
5.45g
0g
2%
Calories
102kcal
83kcal
1%
Vitamin E
1.7mg
1.84mg
1%
Vitamin B1
0.036mg
0.023mg
1%
Vitamin K
2µg
0.3µg
1%
Monounsaturated fat
0.506g
0.129g
1%
Protein per 100 calories
11g
22g
N/A
Calories per 10 g protein
89kcal
46kcal
N/A
Weight per 100 calories
98g
120g
N/A
Unsaturated / Saturated Fat ratio
1.6
1.9
N/A
Net carbs
5.45g
0g
N/A
Vitamin D*
2 IU
0 IU
0%
Magnesium
35mg
36mg
0%
Sugar
1.23g
0g
N/A
Starch
0.9g
0g
0%
Trans fat
0.068g
0.014g
N/A
Tryptophan
0.138mg
0.226mg
0%
Threonine
0.046mg
0.727mg
0%
Isoleucine
0.459mg
0.776mg
0%
Leucine
0.716mg
1.307mg
0%
Lysine
0.762mg
1.386mg
0%
Methionine
0.257mg
0.452mg
0%
Phenylalanine
0.413mg
0.708mg
0%
Valine
0.523mg
0.806mg
0%
Histidine
0.22mg
0.393mg
0%
Omega-3 - EPA
0.353g
0.101g
N/A
Omega-3 - DHA
0.271g
0.067g
N/A
Omega-3 - ALA
0.163g
N/A
Omega-3 - DPA
0.02g
0.009g
N/A
Omega-3 - Eicosatrienoic acid
0.004g
N/A
Omega-6 - Gamma-linoleic acid
0.004g
N/A
Omega-6 - Dihomo-gamma-linoleic acid
0.007g
N/A
Omega-6 - Eicosadienoic acid
0.007g
0.005g
N/A
Omega-6 - Linoleic acid
0.061g
N/A
Macronutrient Comparison
Macronutrient breakdown side-by-side comparison
2
11%
3%
5%
78%
Protein:
11.42 g
Fats:
3.42 g
Carbs:
5.45 g
Water:
78.19 g
Other:
1.52 g
3
18%
80%
2%
Protein:
17.88 g
Fats:
0.74 g
Carbs:
0 g
Water:
79.69 g
Other:
1.69 g
Contains
more
Fats Fats
+362.2%
Contains
more
Carbs Carbs
+∞%
Contains
more
Protein Protein
+56.6%
Contains
more
Other Other
+11.2%
Fat Type Comparison
Fat type breakdown side-by-side comparison
2
38%
20%
42%
Saturated fat:
Sat. Fat
0.948 g
Monounsaturated fat:
Mono. Fat
0.506 g
Polyunsaturated fat:
Poly. Fat
1.056 g
1
34%
22%
44%
Saturated fat:
Sat. Fat
0.201 g
Monounsaturated fat:
Mono. Fat
0.129 g
Polyunsaturated fat:
Poly. Fat
0.258 g
Contains
more
Mono. Fat Monounsaturated fat
+292.2%
Contains
more
Poly. Fat Polyunsaturated fat
+309.3%
Contains
less
Sat. Fat Saturated fat
-78.8%