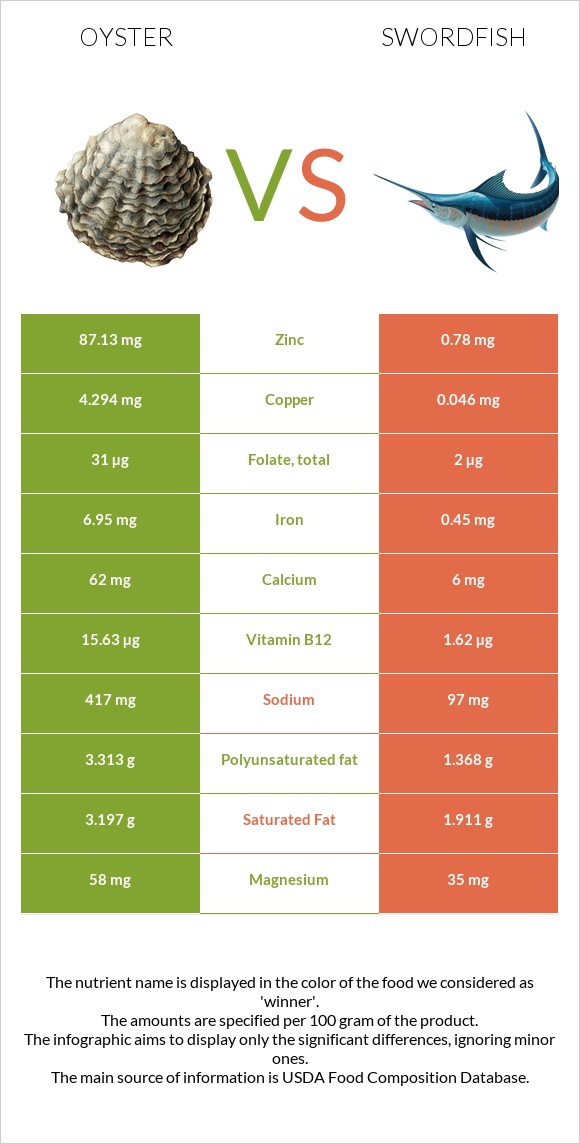
Significant differences between oysters and swordfish Oysters has more zinc, vitamin B12, copper, iron, and manganese; however, swordfish is richer in vitamin D*, selenium, vitamin B3, vitamin B6, and phosphorus. Oysters covers your daily zinc needs 707% more than swordfish. Swordfish has 124 times less copper than oysters. Oysters has 5.707mg of copper, while swordfish has 0.046mg. Specific food types used in this comparison are Mollusks, oyster, eastern, wild, cooked, moist heat and Fish, swordfish, cooked, dry heat .
Infographic
Mineral Comparison
Mineral comparison score is based on the number of minerals by which one or the other food is richer. The "coverage" charts below show how much of the daily needs can be covered by 300 grams of the food.
5
100 g
300 g
6 medium - 42g 3 oz - 85g
Magnesium
Magnesium
Calcium
Calcium
Potassium
Potassium
Iron
Iron
Copper
Copper
Zinc
Zinc
Phosphorus
Phosphorus
Sodium
Sodium
Manganese
Manganese
Selenium
Selenium
25%
35%
12%
345%
1902%
2144%
83%
22%
77%
215%
4
100 g
300 g
3 oz - 85g 1 piece - 106g
Magnesium
Magnesium
Calcium
Calcium
Potassium
Potassium
Iron
Iron
Copper
Copper
Zinc
Zinc
Phosphorus
Phosphorus
Sodium
Sodium
Manganese
Manganese
Selenium
Selenium
25%
1.8%
44%
17%
15%
21%
130%
13%
1.7%
374%
Vitamin Comparison
Vitamin comparison score is based on the number of vitamins by which one or the other food is richer. The "coverage" charts below show how much of the daily needs can be covered by 300 grams of the food.
4
100 g
300 g
6 medium - 42g 3 oz - 85g
Vitamin C
Vit. C
Vitamin D
Vit. D
Vitamin A
Vit. A
Vitamin E
Vit. E
Vitamin B1
Vit. B1
Vitamin B2
Vit. B2
Vitamin B3
Vit. B3
Vitamin B5
Vit. B5
Vitamin B6
Vit. B6
Vitamin B12
Vit. B12
Vitamin K
Vit. K
Folate
Folate
0%
0%
8.7%
34%
9%
42%
35%
27%
14%
2188%
5%
11%
6
100 g
300 g
3 oz - 85g 1 piece - 106g
Vitamin C
Vit. C
Vitamin D
Vit. D
Vitamin A
Vit. A
Vitamin E
Vit. E
Vitamin B1
Vit. B1
Vitamin B2
Vit. B2
Vitamin B3
Vit. B3
Vitamin B5
Vit. B5
Vitamin B6
Vit. B6
Vitamin B12
Vit. B12
Vitamin K
Vit. K
Folate
Folate
0%
249%
14%
48%
22%
15%
174%
25%
142%
203%
0.25%
1.5%
All nutrients comparison - raw data values
Nutrient
DV% diff.
Zinc
78.6mg
0.78mg
707%
Vitamin B12
17.5µg
1.62µg
662%
Copper
5.707mg
0.046mg
629%
Iron
9.21mg
0.45mg
110%
Vitamin D*
2 IU
666 IU
83%
Vitamin D
0µg
16.6µg
83%
Selenium
39.5µg
68.5µg
53%
Vitamin B3
1.85mg
9.254mg
46%
Vitamin B6
0.061mg
0.615mg
43%
Manganese
0.591mg
0.013mg
25%
Protein
11.42g
23.45g
24%
Phosphorus
194mg
304mg
16%
Calcium
116mg
6mg
11%
Potassium
139mg
499mg
11%
Choline
130mg
77.5mg
10%
Vitamin B2
0.18mg
0.063mg
9%
Monounsaturated fat
0.506g
3.544g
8%
Fats
3.42g
7.93g
7%
Vitamin E
1.7mg
2.41mg
5%
Calories
102kcal
172kcal
4%
Vitamin B1
0.036mg
0.089mg
4%
Saturated fat
0.948g
1.911g
4%
Sodium
166mg
97mg
3%
Folate
14µg
2µg
3%
Carbs
5.45g
0g
2%
Vitamin A
26µg
43µg
2%
Vitamin K
2µg
0.1µg
2%
Polyunsaturated fat
1.056g
1.368g
2%
Vitamin B5
0.447mg
0.417mg
1%
Protein per 100 calories
11g
14g
N/A
Calories per 10 g protein
89kcal
73kcal
N/A
Weight per 100 calories
98g
58g
N/A
Unsaturated / Saturated Fat ratio
1.6
2.6
N/A
Net carbs
5.45g
0g
N/A
Cholesterol
79mg
78mg
0%
Magnesium
35mg
35mg
0%
Sugar
1.23g
0g
N/A
Starch
0.9g
0%
Trans fat
0.068g
0.056g
N/A
Tryptophan
0.138mg
0.265mg
0%
Threonine
0.046mg
1.035mg
0%
Isoleucine
0.459mg
1.088mg
0%
Leucine
0.716mg
1.919mg
0%
Lysine
0.762mg
2.168mg
0%
Methionine
0.257mg
0.699mg
0%
Phenylalanine
0.413mg
0.922mg
0%
Valine
0.523mg
1.216mg
0%
Histidine
0.22mg
0.695mg
0%
Omega-3 - EPA
0.353g
0.127g
N/A
Omega-3 - DHA
0.271g
0.772g
N/A
Omega-3 - ALA
0.163g
N/A
Omega-3 - DPA
0.02g
0.168g
N/A
Omega-3 - Eicosatrienoic acid
0.004g
N/A
Omega-6 - Gamma-linoleic acid
0.004g
N/A
Omega-6 - Dihomo-gamma-linoleic acid
0.007g
N/A
Omega-6 - Eicosadienoic acid
0.007g
0.022g
N/A
Omega-6 - Linoleic acid
0.061g
N/A
Macronutrient Comparison
Macronutrient breakdown side-by-side comparison
3
11%
3%
5%
78%
Protein:
11.42 g
Fats:
3.42 g
Carbs:
5.45 g
Water:
78.19 g
Other:
1.52 g
2
23%
8%
68%
Protein:
23.45 g
Fats:
7.93 g
Carbs:
0 g
Water:
68.26 g
Other:
0.36 g
Contains
more
Carbs Carbs
+∞%
Contains
more
Water Water
+14.5%
Contains
more
Other Other
+322.2%
Contains
more
Protein Protein
+105.3%
Contains
more
Fats Fats
+131.9%
Fat Type Comparison
Fat type breakdown side-by-side comparison
1
38%
20%
42%
Saturated fat:
Sat. Fat
0.948 g
Monounsaturated fat:
Mono. Fat
0.506 g
Polyunsaturated fat:
Poly. Fat
1.056 g
2
28%
52%
20%
Saturated fat:
Sat. Fat
1.911 g
Monounsaturated fat:
Mono. Fat
3.544 g
Polyunsaturated fat:
Poly. Fat
1.368 g
Contains
less
Sat. Fat Saturated fat
-50.4%
Contains
more
Mono. Fat Monounsaturated fat
+600.4%
Contains
more
Poly. Fat Polyunsaturated fat
+29.5%