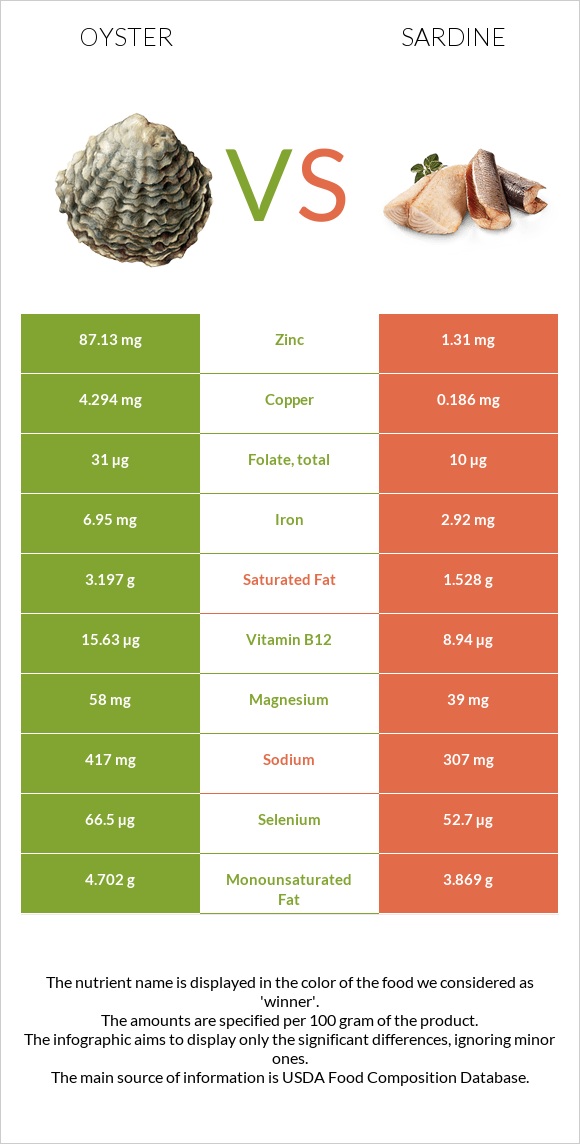
What are the differences between oysters and sardines? Oysters is higher in zinc, copper, vitamin B12, iron, and manganese; however, sardines are richer in phosphorus, calcium, selenium, vitamin D* and vitamin B3. Oysters's daily need coverage for zinc is 703% more. Sardines contain 31 times less copper than oysters. Oysters contains 5.707mg of copper, while sardines contain 0.186mg. We used Mollusks, oyster, eastern, wild, cooked, moist heat and Fish, sardine, Atlantic, canned in oil, drained solids with bone types in this article.
Infographic
Mineral Comparison
Mineral comparison score is based on the number of minerals by which one or the other food is richer. The "coverage" charts below show how much of the daily needs can be covered by 300 grams of the food.
5
100 g
300 g
6 medium - 42g 3 oz - 85g
Magnesium
Magnesium
Calcium
Calcium
Potassium
Potassium
Iron
Iron
Copper
Copper
Zinc
Zinc
Phosphorus
Phosphorus
Sodium
Sodium
Manganese
Manganese
Selenium
Selenium
25%
35%
12%
345%
1902%
2144%
83%
22%
77%
215%
5
100 g
300 g
1 small (2-2/3" x 1/2" x 1/4") - 12g 1 cubic inch - 16g 2 sardines - 24g 1 oz - 28.35g 1 can (3.75 oz) - 92g 1 cup, drained - 149g
Magnesium
Magnesium
Calcium
Calcium
Potassium
Potassium
Iron
Iron
Copper
Copper
Zinc
Zinc
Phosphorus
Phosphorus
Sodium
Sodium
Manganese
Manganese
Selenium
Selenium
28%
115%
35%
110%
62%
36%
210%
40%
14%
287%
Vitamin Comparison
Vitamin comparison score is based on the number of vitamins by which one or the other food is richer. The "coverage" charts below show how much of the daily needs can be covered by 300 grams of the food.
2
100 g
300 g
6 medium - 42g 3 oz - 85g
Vitamin C
Vit. C
Vitamin D
Vit. D
Vitamin A
Vit. A
Vitamin E
Vit. E
Vitamin B1
Vit. B1
Vitamin B2
Vit. B2
Vitamin B3
Vit. B3
Vitamin B5
Vit. B5
Vitamin B6
Vit. B6
Vitamin B12
Vit. B12
Vitamin K
Vit. K
Folate
Folate
0%
0%
8.7%
34%
9%
42%
35%
27%
14%
2188%
5%
11%
9
100 g
300 g
1 small (2-2/3" x 1/2" x 1/4") - 12g 1 cubic inch - 16g 2 sardines - 24g 1 oz - 28.35g 1 can (3.75 oz) - 92g 1 cup, drained - 149g
Vitamin C
Vit. C
Vitamin D
Vit. D
Vitamin A
Vit. A
Vitamin E
Vit. E
Vitamin B1
Vit. B1
Vitamin B2
Vit. B2
Vitamin B3
Vit. B3
Vitamin B5
Vit. B5
Vitamin B6
Vit. B6
Vitamin B12
Vit. B12
Vitamin K
Vit. K
Folate
Folate
0%
72%
11%
41%
20%
52%
98%
39%
39%
1118%
6.5%
7.5%
All nutrients comparison - raw data values
Nutrient
DV% diff.
Zinc
78.6mg
1.31mg
703%
Copper
5.707mg
0.186mg
613%
Vitamin B12
17.5µg
8.94µg
357%
Iron
9.21mg
2.92mg
79%
Phosphorus
194mg
490mg
42%
Calcium
116mg
382mg
27%
Polyunsaturated fat
1.056g
5.148g
27%
Protein
11.42g
24.62g
26%
Vitamin D*
2 IU
193 IU
24%
Vitamin D
0µg
4.8µg
24%
Selenium
39.5µg
52.7µg
24%
Cholesterol
79mg
142mg
21%
Manganese
0.591mg
0.108mg
21%
Vitamin B3
1.85mg
5.245mg
21%
Fats
3.42g
11.45g
12%
Choline
130mg
75mg
10%
Potassium
139mg
397mg
8%
Vitamin B6
0.061mg
0.167mg
8%
Monounsaturated fat
0.506g
3.869g
8%
Sodium
166mg
307mg
6%
Calories
102kcal
208kcal
5%
Vitamin B1
0.036mg
0.08mg
4%
Vitamin B2
0.18mg
0.227mg
4%
Vitamin B5
0.447mg
0.642mg
4%
Saturated fat
0.948g
1.528g
3%
Carbs
5.45g
0g
2%
Vitamin E
1.7mg
2.04mg
2%
Magnesium
35mg
39mg
1%
Vitamin A
26µg
32µg
1%
Vitamin K
2µg
2.6µg
1%
Folate
14µg
10µg
1%
Protein per 100 calories
11g
12g
N/A
Calories per 10 g protein
89kcal
84kcal
N/A
Weight per 100 calories
98g
48g
N/A
Unsaturated / Saturated Fat ratio
1.6
5.9
N/A
Net carbs
5.45g
0g
N/A
Sugar
1.23g
0g
N/A
Starch
0.9g
0%
Trans fat
0.068g
N/A
Tryptophan
0.138mg
0.276mg
0%
Threonine
0.046mg
1.079mg
0%
Isoleucine
0.459mg
1.134mg
0%
Leucine
0.716mg
2.001mg
0%
Lysine
0.762mg
2.26mg
0%
Methionine
0.257mg
0.729mg
0%
Phenylalanine
0.413mg
0.961mg
0%
Valine
0.523mg
1.268mg
0%
Histidine
0.22mg
0.725mg
0%
Omega-3 - EPA
0.353g
0.473g
N/A
Omega-3 - DHA
0.271g
0.509g
N/A
Omega-3 - ALA
0.163g
N/A
Omega-3 - DPA
0.02g
0g
N/A
Omega-3 - Eicosatrienoic acid
0.004g
N/A
Omega-6 - Gamma-linoleic acid
0.004g
N/A
Omega-6 - Dihomo-gamma-linoleic acid
0.007g
N/A
Omega-6 - Eicosadienoic acid
0.007g
N/A
Omega-6 - Linoleic acid
0.061g
N/A
Macronutrient Comparison
Macronutrient breakdown side-by-side comparison
2
11%
3%
5%
78%
Protein:
11.42 g
Fats:
3.42 g
Carbs:
5.45 g
Water:
78.19 g
Other:
1.52 g
3
25%
11%
60%
4%
Protein:
24.62 g
Fats:
11.45 g
Carbs:
0 g
Water:
59.61 g
Other:
4.32 g
Contains
more
Carbs Carbs
+∞%
Contains
more
Water Water
+31.2%
Contains
more
Protein Protein
+115.6%
Contains
more
Fats Fats
+234.8%
Contains
more
Other Other
+184.2%
Fat Type Comparison
Fat type breakdown side-by-side comparison
1
38%
20%
42%
Saturated fat:
Sat. Fat
0.948 g
Monounsaturated fat:
Mono. Fat
0.506 g
Polyunsaturated fat:
Poly. Fat
1.056 g
2
14%
37%
49%
Saturated fat:
Sat. Fat
1.528 g
Monounsaturated fat:
Mono. Fat
3.869 g
Polyunsaturated fat:
Poly. Fat
5.148 g
Contains
less
Sat. Fat Saturated fat
-38%
Contains
more
Mono. Fat Monounsaturated fat
+664.6%
Contains
more
Poly. Fat Polyunsaturated fat
+387.5%