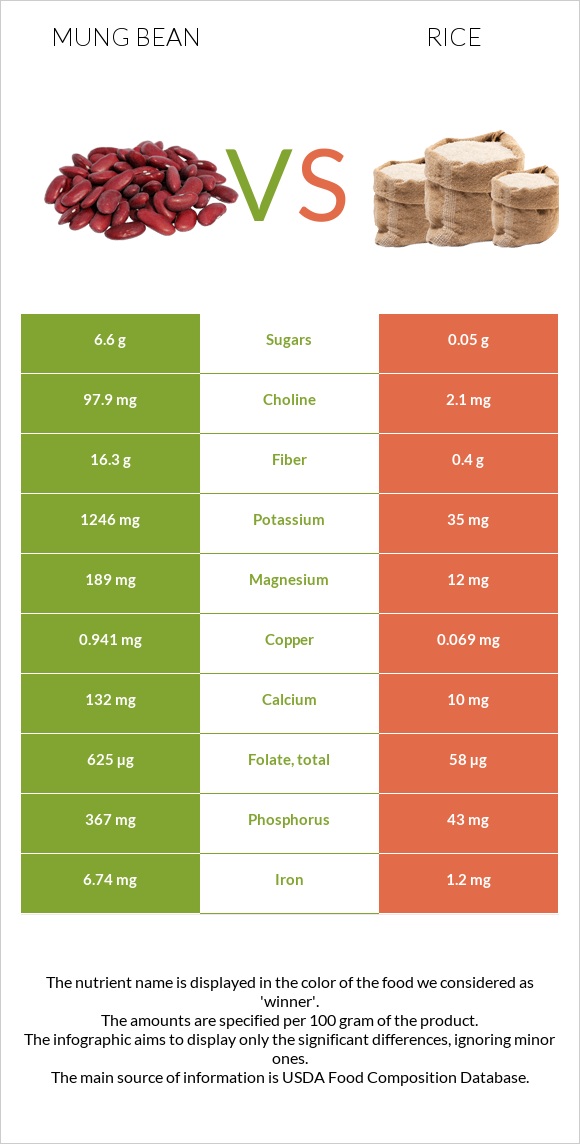
A recap on the differences between mung beans and rice Rice has less folate, copper, iron, fiber, phosphorus, magnesium, vitamin B1, potassium, vitamin B5, and manganese. Mung beans cover your daily folate needs 142% more than rice. Rice contains 41 times less fiber than mung beans. Mung beans contain 16.3g of fiber, while rice contains 0.4g. The glycemic index of rice is higher. Food varieties used in this article are Mung beans, mature seeds, raw and Rice, white, long-grain, regular, enriched, cooked .
Infographic
Mineral Comparison
Mineral comparison score is based on the number of minerals by which one or the other food is richer. The "coverage" charts below show how much of the daily needs can be covered by 300 grams of the food.
8
100 g
300 g
1 tbsp - 13g 1 cup - 207g
Magnesium
Magnesium
Calcium
Calcium
Potassium
Potassium
Iron
Iron
Copper
Copper
Zinc
Zinc
Phosphorus
Phosphorus
Sodium
Sodium
Manganese
Manganese
Selenium
Selenium
135%
40%
110%
253%
314%
73%
157%
2%
135%
45%
1
100 g
300 g
1 cup - 158g
Magnesium
Magnesium
Calcium
Calcium
Potassium
Potassium
Iron
Iron
Copper
Copper
Zinc
Zinc
Phosphorus
Phosphorus
Sodium
Sodium
Manganese
Manganese
Selenium
Selenium
8.6%
3%
3.1%
45%
23%
13%
18%
0.13%
62%
41%
Vitamin Comparison
Vitamin comparison score is based on the number of vitamins by which one or the other food is richer. The "coverage" charts below show how much of the daily needs can be covered by 300 grams of the food.
10
100 g
300 g
1 tbsp - 13g 1 cup - 207g
Vitamin C
Vit. C
Vitamin D
Vit. D
Vitamin A
Vit. A
Vitamin E
Vit. E
Vitamin B1
Vit. B1
Vitamin B2
Vit. B2
Vitamin B3
Vit. B3
Vitamin B5
Vit. B5
Vitamin B6
Vit. B6
Vitamin B12
Vit. B12
Vitamin K
Vit. K
Folate
Folate
16%
0%
2%
10%
155%
54%
42%
115%
88%
0%
23%
469%
0
100 g
300 g
1 cup - 158g
Vitamin C
Vit. C
Vitamin D
Vit. D
Vitamin A
Vit. A
Vitamin E
Vit. E
Vitamin B1
Vit. B1
Vitamin B2
Vit. B2
Vitamin B3
Vit. B3
Vitamin B5
Vit. B5
Vitamin B6
Vit. B6
Vitamin B12
Vit. B12
Vitamin K
Vit. K
Folate
Folate
0%
0%
0%
0.8%
41%
3%
28%
23%
21%
0%
0%
44%
All nutrients comparison - raw data values
Nutrient
DV% diff.
Folate
625µg
58µg
142%
Copper
0.941mg
0.069mg
97%
Iron
6.74mg
1.2mg
69%
Fiber
16.3g
0.4g
64%
Phosphorus
367mg
43mg
46%
Protein
23.86g
2.69g
42%
Magnesium
189mg
12mg
42%
Vitamin B1
0.621mg
0.163mg
38%
Potassium
1246mg
35mg
36%
Vitamin B5
1.91mg
0.39mg
30%
Manganese
1.035mg
0.472mg
24%
Vitamin B6
0.382mg
0.093mg
22%
Zinc
2.68mg
0.49mg
20%
Vitamin B2
0.233mg
0.013mg
17%
Choline
97.9mg
2.1mg
17%
Calcium
132mg
10mg
12%
Calories
347kcal
130kcal
11%
Carbs
62.62g
28.17g
11%
Vitamin K
9µg
0µg
8%
Vitamin C
4.8mg
0mg
5%
Vitamin B3
2.251mg
1.476mg
5%
Vitamin E
0.51mg
0.04mg
3%
Polyunsaturated fat
0.384g
0.076g
2%
Fats
1.15g
0.28g
1%
Sodium
15mg
1mg
1%
Vitamin A
6µg
0µg
1%
Selenium
8.2µg
7.5µg
1%
Saturated fat
0.348g
0.077g
1%
Protein per 100 calories
6.9g
2.1g
N/A
Calories per 10 g protein
145kcal
483kcal
N/A
Weight per 100 calories
29g
77g
N/A
Net carbs
46.32g
27.77g
N/A
Sugar
6.6g
0.05g
N/A
Monounsaturated fat
0.161g
0.088g
0%
Tryptophan
0.26mg
0.031mg
0%
Threonine
0.782mg
0.096mg
0%
Isoleucine
1.008mg
0.116mg
0%
Leucine
1.847mg
0.222mg
0%
Lysine
1.664mg
0.097mg
0%
Methionine
0.286mg
0.063mg
0%
Phenylalanine
1.443mg
0.144mg
0%
Valine
1.237mg
0.164mg
0%
Histidine
0.695mg
0.063mg
0%
Macronutrient Comparison
Macronutrient breakdown side-by-side comparison
4
24%
63%
9%
3%
Protein:
23.86 g
Fats:
1.15 g
Carbs:
62.62 g
Water:
9.05 g
Other:
3.32 g
1
3%
28%
68%
Protein:
2.69 g
Fats:
0.28 g
Carbs:
28.17 g
Water:
68.44 g
Other:
0.42 g
Contains
more
Protein Protein
+787%
Contains
more
Fats Fats
+310.7%
Contains
more
Carbs Carbs
+122.3%
Contains
more
Other Other
+690.5%
Contains
more
Water Water
+656.2%
Fat Type Comparison
Fat type breakdown side-by-side comparison
2
39%
18%
43%
Saturated fat:
Sat. Fat
0.348 g
Monounsaturated fat:
Mono. Fat
0.161 g
Polyunsaturated fat:
Poly. Fat
0.384 g
1
32%
37%
32%
Saturated fat:
Sat. Fat
0.077 g
Monounsaturated fat:
Mono. Fat
0.088 g
Polyunsaturated fat:
Poly. Fat
0.076 g
Contains
more
Mono. Fat Monounsaturated fat
+83%
Contains
more
Poly. Fat Polyunsaturated fat
+405.3%
Contains
less
Sat. Fat Saturated fat
-77.9%