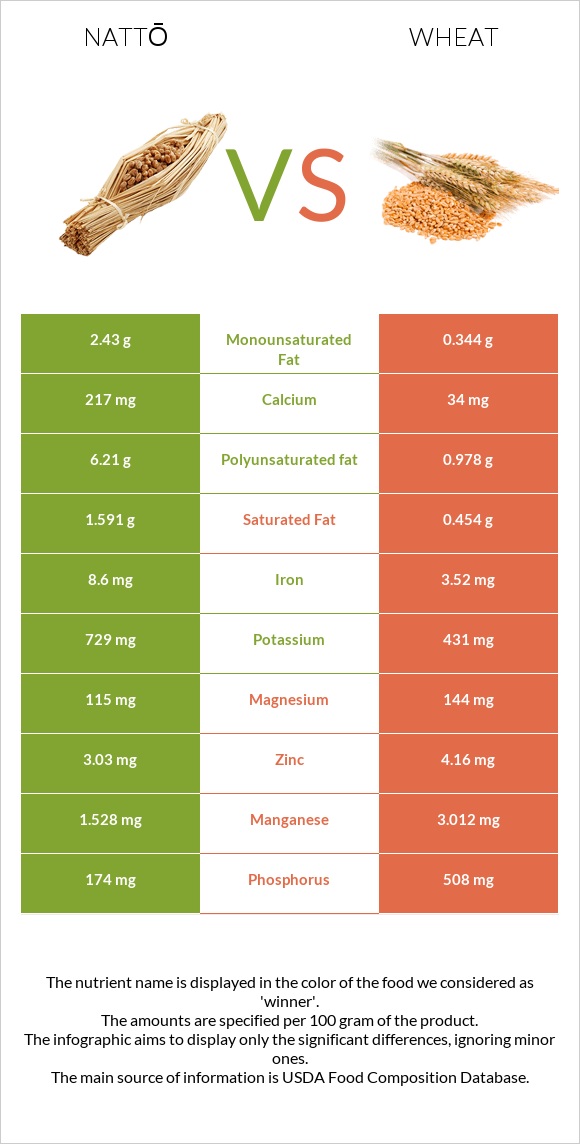
How are nattō and wheat different? Nattō is higher in iron, calcium, and vitamin C; however, wheat is richer in selenium, manganese, phosphorus, vitamin B3, vitamin B6, vitamin B1, and vitamin B5. Daily need coverage for selenium for wheat is 147% higher. Natto and Wheat, durum are the varieties used in this article.
Infographic
Mineral Comparison
Mineral comparison score is based on the number of minerals by which one or the other food is richer. The "coverage" charts below show how much of the daily needs can be covered by 300 grams of the food.
4
100 g
300 g
1 cup - 175g
Magnesium
Magnesium
Calcium
Calcium
Potassium
Potassium
Iron
Iron
Copper
Copper
Zinc
Zinc
Phosphorus
Phosphorus
Sodium
Sodium
Manganese
Manganese
Selenium
Selenium
82%
65%
64%
323%
222%
83%
75%
0.91%
199%
48%
6
100 g
300 g
1 cup - 192g
Magnesium
Magnesium
Calcium
Calcium
Potassium
Potassium
Iron
Iron
Copper
Copper
Zinc
Zinc
Phosphorus
Phosphorus
Sodium
Sodium
Manganese
Manganese
Selenium
Selenium
103%
10%
38%
132%
184%
113%
218%
0.26%
393%
488%
Vitamin Comparison
Vitamin comparison score is based on the number of vitamins by which one or the other food is richer. The "coverage" charts below show how much of the daily needs can be covered by 300 grams of the food.
4
100 g
300 g
1 cup - 175g
Vitamin C
Vit. C
Vitamin D
Vit. D
Vitamin A
Vit. A
Vitamin E
Vit. E
Vitamin B1
Vit. B1
Vitamin B2
Vit. B2
Vitamin B3
Vit. B3
Vitamin B5
Vit. B5
Vitamin B6
Vit. B6
Vitamin B12
Vit. B12
Vitamin K
Vit. K
Folate
Folate
43%
0%
0%
0.2%
40%
44%
0%
13%
30%
0%
58%
6%
5
100 g
300 g
1 cup - 192g
Vitamin C
Vit. C
Vitamin D
Vit. D
Vitamin A
Vit. A
Vitamin E
Vit. E
Vitamin B1
Vit. B1
Vitamin B2
Vit. B2
Vitamin B3
Vit. B3
Vitamin B5
Vit. B5
Vitamin B6
Vit. B6
Vitamin B12
Vit. B12
Vitamin K
Vit. K
Folate
Folate
0%
0%
0%
0%
105%
28%
126%
56%
97%
0%
0%
32%
All nutrients comparison - raw data values
Nutrient
DV% diff.
Selenium
8.8µg
89.4µg
147%
Manganese
1.528mg
3.012mg
65%
Iron
8.6mg
3.52mg
64%
Phosphorus
174mg
508mg
48%
Vitamin B3
0mg
6.738mg
42%
Polyunsaturated fat
6.21g
0.978g
35%
Fiber
5.4g
22%
Vitamin B1
0.16mg
0.419mg
22%
Vitamin B6
0.13mg
0.419mg
22%
Carbs
12.68g
71.13g
19%
Vitamin K
23.1µg
19%
Calcium
217mg
34mg
18%
Vitamin C
13mg
0mg
14%
Vitamin B5
0.215mg
0.935mg
14%
Fats
11g
2.47g
13%
Copper
0.667mg
0.553mg
13%
Protein
19.4g
13.68g
11%
Zinc
3.03mg
4.16mg
10%
Choline
57mg
10%
Potassium
729mg
431mg
9%
Folate
8µg
43µg
9%
Magnesium
115mg
144mg
7%
Calories
211kcal
339kcal
6%
Vitamin B2
0.19mg
0.121mg
5%
Saturated fat
1.591g
0.454g
5%
Monounsaturated fat
2.43g
0.344g
5%
Protein per 100 calories
9.2g
4g
N/A
Calories per 10 g protein
109kcal
248kcal
N/A
Weight per 100 calories
47g
29g
N/A
Unsaturated / Saturated Fat ratio
5.4
2.9
N/A
Net carbs
7.28g
71.13g
N/A
Sugar
4.89g
N/A
Sodium
7mg
2mg
0%
Vitamin E
0.01mg
0%
Tryptophan
0.223mg
0.176mg
0%
Threonine
0.813mg
0.366mg
0%
Isoleucine
0.931mg
0.533mg
0%
Leucine
1.509mg
0.934mg
0%
Lysine
1.145mg
0.303mg
0%
Methionine
0.208mg
0.221mg
0%
Phenylalanine
0.941mg
0.681mg
0%
Valine
1.018mg
0.594mg
0%
Histidine
0.512mg
0.322mg
0%
Macronutrient Comparison
Macronutrient breakdown side-by-side comparison
4
19%
11%
13%
55%
2%
Protein:
19.4 g
Fats:
11 g
Carbs:
12.68 g
Water:
55.02 g
Other:
1.9 g
1
14%
2%
71%
11%
2%
Protein:
13.68 g
Fats:
2.47 g
Carbs:
71.13 g
Water:
10.94 g
Other:
1.78 g
Contains
more
Protein Protein
+41.8%
Contains
more
Fats Fats
+345.3%
Contains
more
Water Water
+402.9%
Contains
more
Carbs Carbs
+461%
Fat Type Comparison
Fat type breakdown side-by-side comparison
2
16%
24%
61%
Saturated fat:
Sat. Fat
1.591 g
Monounsaturated fat:
Mono. Fat
2.43 g
Polyunsaturated fat:
Poly. Fat
6.21 g
1
26%
19%
55%
Saturated fat:
Sat. Fat
0.454 g
Monounsaturated fat:
Mono. Fat
0.344 g
Polyunsaturated fat:
Poly. Fat
0.978 g
Contains
more
Mono. Fat Monounsaturated fat
+606.4%
Contains
more
Poly. Fat Polyunsaturated fat
+535%
Contains
less
Sat. Fat Saturated fat
-71.5%