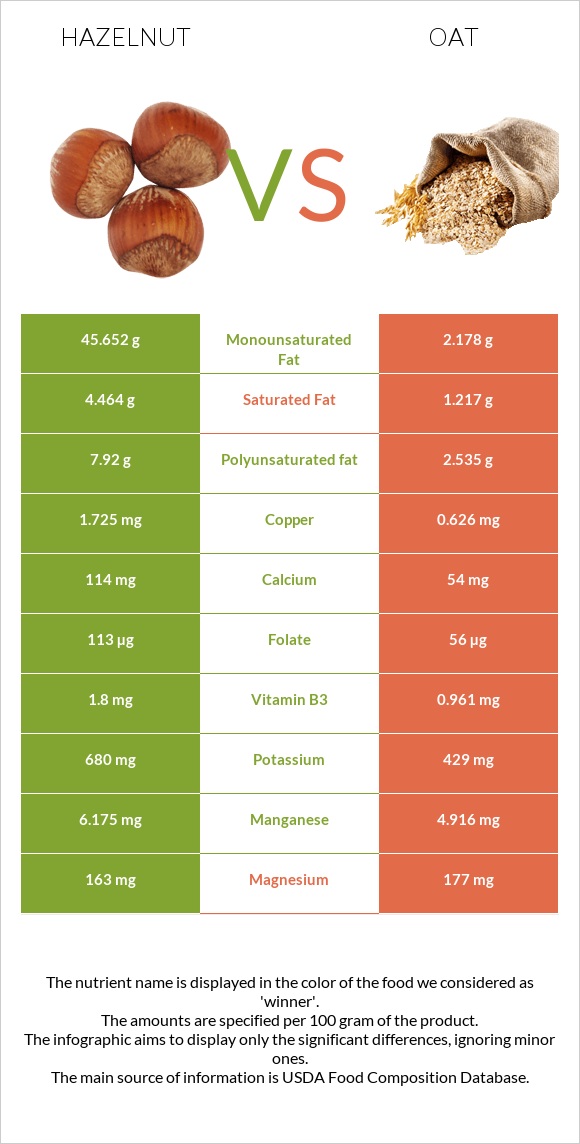
How are hazelnut and oats different? Hazelnut is richer in copper, manganese, vitamin B6, folate, and potassium, while oats are higher in phosphorus, zinc, vitamin B1, and vitamin B5. Hazelnut covers your daily need for copper, 122% more than oats. Hazelnut contains 5 times more vitamin B6 than oats. Hazelnut contains 0.563mg of vitamin B6, while oats contain 0.119mg. Oats are lower in saturated fat. Oats have a higher glycemic index (59) than hazelnut (15). Nuts, hazelnuts or filberts and Oats types were used in this article.
Infographic
Mineral Comparison
Mineral comparison score is based on the number of minerals by which one or the other food is richer. The "coverage" charts below show how much of the daily needs can be covered by 300 grams of the food.
6
100 g
300 g
10 nuts - 14g 1 oz (21 whole kernels) - 28.35g 1 cup, ground - 75g 1 cup, chopped - 115g 1 cup, whole - 135g
Magnesium
Magnesium
Calcium
Calcium
Potassium
Potassium
Iron
Iron
Copper
Copper
Zinc
Zinc
Phosphorus
Phosphorus
Sodium
Sodium
Manganese
Manganese
Selenium
Selenium
116%
34%
60%
176%
575%
67%
124%
0%
805%
13%
2
100 g
300 g
1 cup - 156g
Magnesium
Magnesium
Calcium
Calcium
Potassium
Potassium
Iron
Iron
Copper
Copper
Zinc
Zinc
Phosphorus
Phosphorus
Sodium
Sodium
Manganese
Manganese
Selenium
Selenium
126%
16%
38%
177%
209%
108%
224%
0.26%
641%
0%
Vitamin Comparison
Vitamin comparison score is based on the number of vitamins by which one or the other food is richer. The "coverage" charts below show how much of the daily needs can be covered by 300 grams of the food.
7
100 g
300 g
10 nuts - 14g 1 oz (21 whole kernels) - 28.35g 1 cup, ground - 75g 1 cup, chopped - 115g 1 cup, whole - 135g
Vitamin C
Vit. C
Vitamin D
Vit. D
Vitamin A
Vit. A
Vitamin E
Vit. E
Vitamin B1
Vit. B1
Vitamin B2
Vit. B2
Vitamin B3
Vit. B3
Vitamin B5
Vit. B5
Vitamin B6
Vit. B6
Vitamin B12
Vit. B12
Vitamin K
Vit. K
Folate
Folate
21%
0%
0.33%
301%
161%
26%
34%
55%
130%
0%
36%
85%
3
100 g
300 g
1 cup - 156g
Vitamin C
Vit. C
Vitamin D
Vit. D
Vitamin A
Vit. A
Vitamin E
Vit. E
Vitamin B1
Vit. B1
Vitamin B2
Vit. B2
Vitamin B3
Vit. B3
Vitamin B5
Vit. B5
Vitamin B6
Vit. B6
Vitamin B12
Vit. B12
Vitamin K
Vit. K
Folate
Folate
0%
0%
0%
0%
191%
32%
18%
81%
27%
0%
0%
42%
All nutrients comparison - raw data values
Nutrient
DV% diff.
Copper
1.725mg
0.626mg
122%
Monounsaturated fat
45.652g
2.178g
109%
Vitamin E
15.03mg
100%
Fats
60.75g
6.9g
83%
Manganese
6.175mg
4.916mg
55%
Polyunsaturated fat
7.92g
2.535g
36%
Vitamin B6
0.563mg
0.119mg
34%
Phosphorus
290mg
523mg
33%
Carbs
16.7g
66.27g
17%
Saturated fat
4.464g
1.217g
15%
Zinc
2.45mg
3.97mg
14%
Folate
113µg
56µg
14%
Calories
628kcal
389kcal
12%
Vitamin K
14.2µg
12%
Vitamin B1
0.643mg
0.763mg
10%
Vitamin B5
0.918mg
1.349mg
9%
Choline
45.6mg
8%
Vitamin C
6.3mg
0mg
7%
Potassium
680mg
429mg
7%
Calcium
114mg
54mg
6%
Vitamin B3
1.8mg
0.961mg
5%
Protein
14.95g
16.89g
4%
Fiber
9.7g
10.6g
4%
Selenium
2.4µg
4%
Magnesium
163mg
177mg
3%
Vitamin B2
0.113mg
0.139mg
2%
Protein per 100 calories
2.4g
4.3g
N/A
Calories per 10 g protein
420kcal
230kcal
N/A
Weight per 100 calories
16g
26g
N/A
Unsaturated / Saturated Fat ratio
12
3.9
N/A
Net carbs
7g
55.67g
N/A
Iron
4.7mg
4.72mg
0%
Sugar
4.34g
N/A
Starch
0.48g
0%
Sodium
0mg
2mg
0%
Vitamin A
1µg
0µg
0%
Tryptophan
0.193mg
0.234mg
0%
Threonine
0.497mg
0.575mg
0%
Isoleucine
0.545mg
0.694mg
0%
Leucine
1.063mg
1.284mg
0%
Lysine
0.42mg
0.701mg
0%
Methionine
0.221mg
0.312mg
0%
Phenylalanine
0.663mg
0.895mg
0%
Valine
0.701mg
0.937mg
0%
Histidine
0.432mg
0.405mg
0%
Fructose
0.07g
0%
Macronutrient Comparison
Macronutrient breakdown side-by-side comparison
2
15%
61%
17%
5%
2%
Protein:
14.95 g
Fats:
60.75 g
Carbs:
16.7 g
Water:
5.31 g
Other:
2.29 g
3
17%
7%
66%
8%
2%
Protein:
16.89 g
Fats:
6.9 g
Carbs:
66.27 g
Water:
8.22 g
Other:
1.72 g
Contains
more
Fats Fats
+780.4%
Contains
more
Other Other
+33.1%
Contains
more
Protein Protein
+13%
Contains
more
Carbs Carbs
+296.8%
Contains
more
Water Water
+54.8%
Fat Type Comparison
Fat type breakdown side-by-side comparison
2
8%
79%
14%
Saturated fat:
Sat. Fat
4.464 g
Monounsaturated fat:
Mono. Fat
45.652 g
Polyunsaturated fat:
Poly. Fat
7.92 g
1
21%
37%
43%
Saturated fat:
Sat. Fat
1.217 g
Monounsaturated fat:
Mono. Fat
2.178 g
Polyunsaturated fat:
Poly. Fat
2.535 g
Contains
more
Mono. Fat Monounsaturated fat
+1996.1%
Contains
more
Poly. Fat Polyunsaturated fat
+212.4%
Contains
less
Sat. Fat Saturated fat
-72.7%