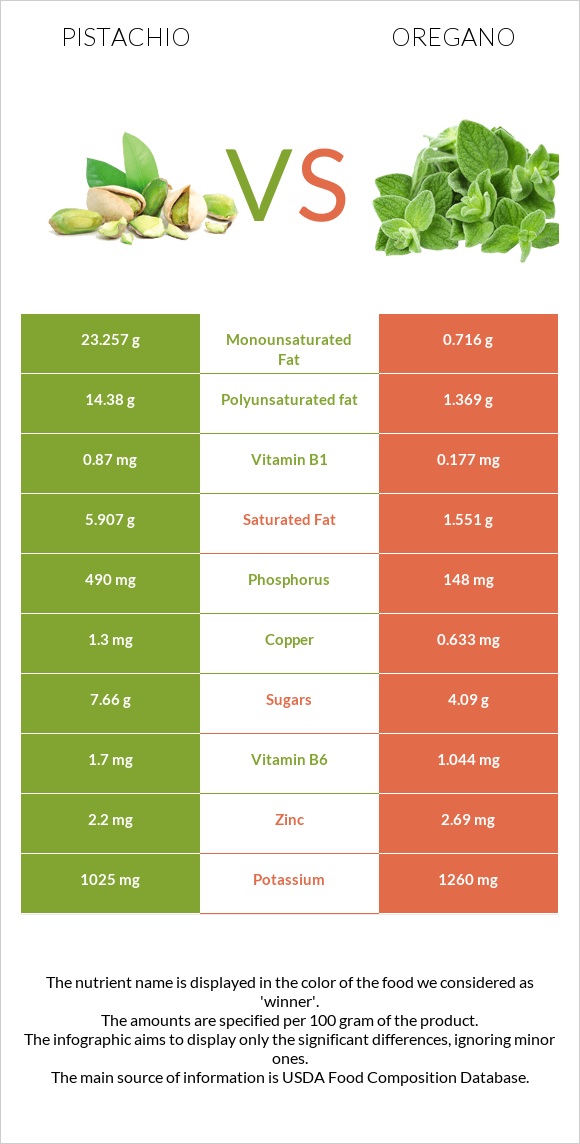
How are pistachios and oregano different? Pistachios are richer in copper, vitamin B1, vitamin B6, and phosphorus, while oregano is higher in iron, manganese, calcium, fiber, vitamin E, and folate. Oregano covers your daily need for iron, 411% more than pistachios. Pistachios contain 5 times more vitamin B1 than oregano. Pistachios contain 0.87mg of vitamin B1, while oregano contains 0.177mg. Pistachios have a higher glycemic index (28) than oregano (5). Nuts, pistachio nuts, raw and Spices, oregano, dried types were used in this article.
Infographic
Mineral Comparison
Mineral comparison score is based on the number of minerals by which one or the other food is richer. The "coverage" charts below show how much of the daily needs can be covered by 300 grams of the food.
4
100 g
300 g
1 kernel - 0.7g 1 oz (49 kernels) - 28.35g 1 cup - 123g
Magnesium
Magnesium
Calcium
Calcium
Potassium
Potassium
Iron
Iron
Copper
Copper
Zinc
Zinc
Phosphorus
Phosphorus
Sodium
Sodium
Manganese
Manganese
Selenium
Selenium
86%
32%
90%
147%
433%
60%
210%
0.13%
157%
38%
6
100 g
300 g
0.25 tsp - 0.5g 1 tsp, ground - 1.8g
Magnesium
Magnesium
Calcium
Calcium
Potassium
Potassium
Iron
Iron
Copper
Copper
Zinc
Zinc
Phosphorus
Phosphorus
Sodium
Sodium
Manganese
Manganese
Selenium
Selenium
193%
479%
111%
1380%
211%
73%
63%
3.3%
651%
25%
Vitamin Comparison
Vitamin comparison score is based on the number of vitamins by which one or the other food is richer. The "coverage" charts below show how much of the daily needs can be covered by 300 grams of the food.
3
100 g
300 g
1 kernel - 0.7g 1 oz (49 kernels) - 28.35g 1 cup - 123g
Vitamin C
Vit. C
Vitamin D
Vit. D
Vitamin A
Vit. A
Vitamin E
Vit. E
Vitamin B1
Vit. B1
Vitamin B2
Vit. B2
Vitamin B3
Vit. B3
Vitamin B5
Vit. B5
Vitamin B6
Vit. B6
Vitamin B12
Vit. B12
Vitamin K
Vit. K
Folate
Folate
19%
0%
8.7%
57%
218%
37%
24%
31%
392%
0%
0%
38%
7
100 g
300 g
0.25 tsp - 0.5g 1 tsp, ground - 1.8g
Vitamin C
Vit. C
Vitamin D
Vit. D
Vitamin A
Vit. A
Vitamin E
Vit. E
Vitamin B1
Vit. B1
Vitamin B2
Vit. B2
Vitamin B3
Vit. B3
Vitamin B5
Vit. B5
Vitamin B6
Vit. B6
Vitamin B12
Vit. B12
Vitamin K
Vit. K
Folate
Folate
7.7%
0%
28%
365%
44%
122%
87%
55%
241%
0%
1554%
178%
All nutrients comparison - raw data values
Nutrient
DV% diff.
Vitamin K
621.7µg
518%
Iron
3.92mg
36.8mg
411%
Manganese
1.2mg
4.99mg
165%
Calcium
105mg
1597mg
149%
Fiber
10.6g
42.5g
128%
Vitamin E
2.86mg
18.26mg
103%
Polyunsaturated fat
14.38g
1.369g
87%
Copper
1.3mg
0.633mg
74%
Fats
45.32g
4.28g
63%
Vitamin B1
0.87mg
0.177mg
58%
Monounsaturated fat
23.257g
0.716g
56%
Vitamin B6
1.7mg
1.044mg
50%
Phosphorus
490mg
148mg
49%
Folate
51µg
237µg
47%
Magnesium
121mg
270mg
35%
Vitamin B2
0.16mg
0.528mg
28%
Protein
20.16g
9g
22%
Vitamin B3
1.3mg
4.64mg
21%
Saturated fat
5.907g
1.551g
20%
Calories
560kcal
265kcal
15%
Carbs
27.17g
68.92g
14%
Vitamin B5
0.52mg
0.921mg
8%
Potassium
1025mg
1260mg
7%
Vitamin A
26µg
85µg
7%
Choline
32.3mg
6%
Selenium
7µg
4.5µg
5%
Vitamin C
5.6mg
2.3mg
4%
Zinc
2.2mg
2.69mg
4%
Starch
1.67g
1%
Sodium
1mg
25mg
1%
Fructose
0.24g
1.13g
1%
Protein per 100 calories
3.6g
3.4g
N/A
Calories per 10 g protein
278kcal
294kcal
N/A
Weight per 100 calories
18g
38g
N/A
Unsaturated / Saturated Fat ratio
6.4
1.3
N/A
Net carbs
16.57g
26.42g
N/A
Sugar
7.66g
4.09g
N/A
Tryptophan
0.251mg
0.203mg
0%
Threonine
0.684mg
0.322mg
0%
Isoleucine
0.917mg
0.441mg
0%
Leucine
1.604mg
0.78mg
0%
Lysine
1.138mg
0.5mg
0%
Methionine
0.36mg
0.127mg
0%
Phenylalanine
1.092mg
0.449mg
0%
Valine
1.249mg
0.585mg
0%
Histidine
0.512mg
0.144mg
0%
Omega-3 - ALA
0.621g
N/A
Omega-6 - Linoleic acid
14.091g
N/A
Macronutrient Comparison
Macronutrient breakdown side-by-side comparison
2
20%
45%
27%
4%
3%
Protein:
20.16 g
Fats:
45.32 g
Carbs:
27.17 g
Water:
4.37 g
Other:
2.98 g
3
9%
4%
69%
10%
8%
Protein:
9 g
Fats:
4.28 g
Carbs:
68.92 g
Water:
9.93 g
Other:
7.87 g
Contains
more
Protein Protein
+124%
Contains
more
Fats Fats
+958.9%
Contains
more
Carbs Carbs
+153.7%
Contains
more
Water Water
+127.2%
Contains
more
Other Other
+164.1%
Fat Type Comparison
Fat type breakdown side-by-side comparison
2
14%
53%
33%
Saturated fat:
Sat. Fat
5.907 g
Monounsaturated fat:
Mono. Fat
23.257 g
Polyunsaturated fat:
Poly. Fat
14.38 g
1
43%
20%
38%
Saturated fat:
Sat. Fat
1.551 g
Monounsaturated fat:
Mono. Fat
0.716 g
Polyunsaturated fat:
Poly. Fat
1.369 g
Contains
more
Mono. Fat Monounsaturated fat
+3148.2%
Contains
more
Poly. Fat Polyunsaturated fat
+950.4%
Contains
less
Sat. Fat Saturated fat
-73.7%
Carbohydrate type comparison
Carbohydrate type breakdown side-by-side comparison
3
18%
74%
3%
3%
2%
Starch:
1.67 g
Sucrose:
6.87 g
Glucose:
0.32 g
Fructose:
0.24 g
Lactose:
0 g
Maltose:
0.17 g
Galactose:
0 g
3
22%
46%
28%
4%
Starch:
0 g
Sucrose:
0.91 g
Glucose:
1.9 g
Fructose:
1.13 g
Lactose:
0 g
Maltose:
0 g
Galactose:
0.15 g
Contains
more
Starch Starch
+∞%
Contains
more
Sucrose Sucrose
+654.9%
Contains
more
Maltose Maltose
+∞%
Contains
more
Glucose Glucose
+493.8%
Contains
more
Fructose Fructose
+370.8%
Contains
more
Galactose Galactose
+∞%