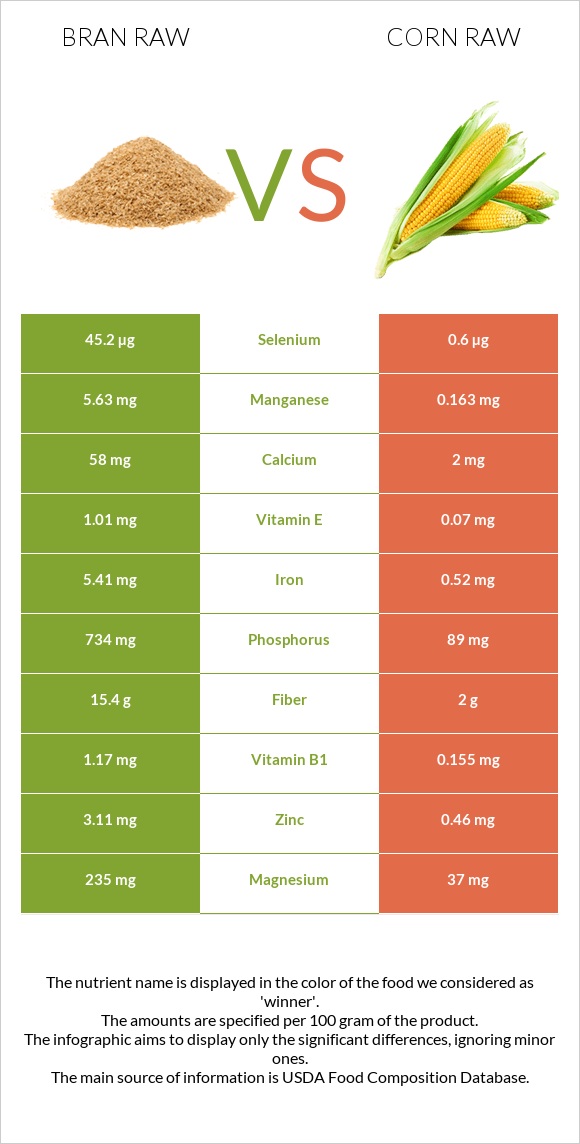
Significant differences between bran raw and corn raw The amount of manganese, phosphorus, vitamin B1, selenium, iron, fiber, magnesium, copper, zinc, and vitamin B5 in bran raw is higher than in corn raw. Bran raw covers your daily manganese needs 238% more than corn raw. Corn raw has 75 times less selenium than bran raw. Bran raw has 45.2µg of selenium, while corn raw has 0.6µg. Specific food types used in this comparison are Oat bran, raw and Corn, sweet, yellow, raw .
Infographic
Mineral Comparison
Mineral comparison score is based on the number of minerals by which one or the other food is richer. The "coverage" charts below show how much of the daily needs can be covered by 300 grams of the food.
10
100 g
300 g
1 cup - 94g
Magnesium
Magnesium
Calcium
Calcium
Potassium
Potassium
Iron
Iron
Copper
Copper
Zinc
Zinc
Phosphorus
Phosphorus
Sodium
Sodium
Manganese
Manganese
Selenium
Selenium
168%
17%
50%
203%
134%
85%
315%
0.52%
734%
247%
0
100 g
300 g
1 ear, small (5-1/2" to 6-1/2" long) - 73g 1 ear, medium (6-3/4" to 7-1/2" long) yields - 102g 1 ear, large (7-3/4" to 9" long) yields - 143g 1 cup - 145g
Magnesium
Magnesium
Calcium
Calcium
Potassium
Potassium
Iron
Iron
Copper
Copper
Zinc
Zinc
Phosphorus
Phosphorus
Sodium
Sodium
Manganese
Manganese
Selenium
Selenium
26%
0.6%
24%
20%
18%
13%
38%
2%
21%
3.3%
Vitamin Comparison
Vitamin comparison score is based on the number of vitamins by which one or the other food is richer. The "coverage" charts below show how much of the daily needs can be covered by 300 grams of the food.
7
100 g
300 g
1 cup - 94g
Vitamin C
Vit. C
Vitamin D
Vit. D
Vitamin A
Vit. A
Vitamin E
Vit. E
Vitamin B1
Vit. B1
Vitamin B2
Vit. B2
Vitamin B3
Vit. B3
Vitamin B5
Vit. B5
Vitamin B6
Vit. B6
Vitamin B12
Vit. B12
Vitamin K
Vit. K
Folate
Folate
0%
0%
0%
20%
293%
51%
18%
90%
38%
0%
8%
39%
3
100 g
300 g
1 ear, small (5-1/2" to 6-1/2" long) - 73g 1 ear, medium (6-3/4" to 7-1/2" long) yields - 102g 1 ear, large (7-3/4" to 9" long) yields - 143g 1 cup - 145g
Vitamin C
Vit. C
Vitamin D
Vit. D
Vitamin A
Vit. A
Vitamin E
Vit. E
Vitamin B1
Vit. B1
Vitamin B2
Vit. B2
Vitamin B3
Vit. B3
Vitamin B5
Vit. B5
Vitamin B6
Vit. B6
Vitamin B12
Vit. B12
Vitamin K
Vit. K
Folate
Folate
23%
0%
3%
1.4%
39%
13%
33%
43%
21%
0%
0.75%
32%
All nutrients comparison - raw data values
Nutrient
DV% diff.
Manganese
5.63mg
0.163mg
238%
Phosphorus
734mg
89mg
92%
Vitamin B1
1.17mg
0.155mg
85%
Selenium
45.2µg
0.6µg
81%
Iron
5.41mg
0.52mg
61%
Fiber
15.4g
2g
54%
Magnesium
235mg
37mg
47%
Copper
0.403mg
0.054mg
39%
Protein
17.3g
3.27g
28%
Zinc
3.11mg
0.46mg
24%
Carbs
66.22g
18.7g
16%
Vitamin B5
1.494mg
0.717mg
16%
Polyunsaturated fat
2.766g
0.487g
15%
Vitamin B2
0.22mg
0.055mg
13%
Fats
7.03g
1.35g
9%
Potassium
566mg
270mg
9%
Calories
246kcal
86kcal
8%
Vitamin C
0mg
6.8mg
8%
Calcium
58mg
2mg
6%
Vitamin E
1.01mg
0.07mg
6%
Vitamin B6
0.165mg
0.093mg
6%
Vitamin B3
0.934mg
1.77mg
5%
Saturated fat
1.328g
0.325g
5%
Monounsaturated fat
2.376g
0.432g
5%
Folate
52µg
42µg
3%
Starch
5.7g
2%
Vitamin K
3.2µg
0.3µg
2%
Choline
32.2mg
23mg
2%
Fructose
1.94g
2%
Vitamin A
0µg
9µg
1%
Protein per 100 calories
7g
3.8g
N/A
Calories per 10 g protein
142kcal
263kcal
N/A
Weight per 100 calories
41g
116g
N/A
Unsaturated / Saturated Fat ratio
3.9
2.8
N/A
Net carbs
50.82g
16.7g
N/A
Sugar
1.45g
6.26g
N/A
Sodium
4mg
15mg
0%
Tryptophan
0.335mg
0.023mg
0%
Threonine
0.502mg
0.129mg
0%
Isoleucine
0.668mg
0.129mg
0%
Leucine
1.374mg
0.348mg
0%
Lysine
0.76mg
0.137mg
0%
Methionine
0.335mg
0.067mg
0%
Phenylalanine
0.908mg
0.15mg
0%
Valine
0.964mg
0.185mg
0%
Histidine
0.41mg
0.089mg
0%
Omega-3 - ALA
0.014g
N/A
Omega-6 - Linoleic acid
0.468g
N/A
Macronutrient Comparison
Macronutrient breakdown side-by-side comparison
4
17%
7%
66%
7%
3%
Protein:
17.3 g
Fats:
7.03 g
Carbs:
66.22 g
Water:
6.55 g
Other:
2.9 g
1
3%
19%
76%
Protein:
3.27 g
Fats:
1.35 g
Carbs:
18.7 g
Water:
76.05 g
Other:
0.63 g
Contains
more
Protein Protein
+429.1%
Contains
more
Fats Fats
+420.7%
Contains
more
Carbs Carbs
+254.1%
Contains
more
Other Other
+360.3%
Contains
more
Water Water
+1061.1%
Fat Type Comparison
Fat type breakdown side-by-side comparison
2
21%
37%
43%
Saturated fat:
Sat. Fat
1.328 g
Monounsaturated fat:
Mono. Fat
2.376 g
Polyunsaturated fat:
Poly. Fat
2.766 g
1
26%
35%
39%
Saturated fat:
Sat. Fat
0.325 g
Monounsaturated fat:
Mono. Fat
0.432 g
Polyunsaturated fat:
Poly. Fat
0.487 g
Contains
more
Mono. Fat Monounsaturated fat
+450%
Contains
more
Poly. Fat Polyunsaturated fat
+468%
Contains
less
Sat. Fat Saturated fat
-75.5%