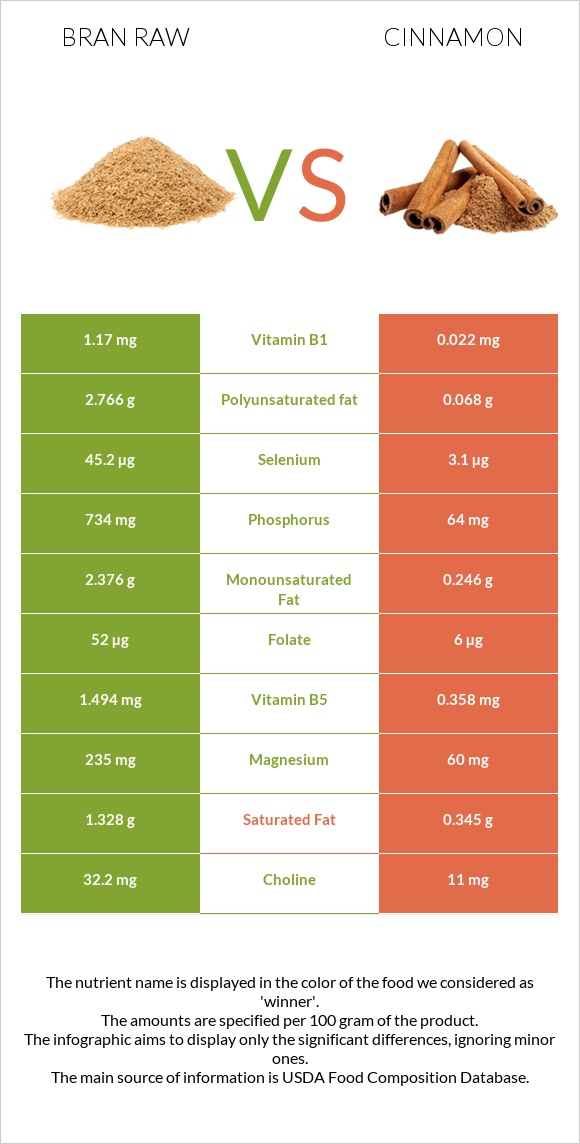
Summary of differences between bran raw and cinnamon Bran raw has more phosphorus, vitamin B1, selenium, magnesium, and vitamin B5, while cinnamon has more manganese, fiber, calcium, iron, and vitamin K. Cinnamon covers your daily need for manganese, 515% more than bran raw. Bran raw contains 53 times more vitamin B1 than cinnamon. While bran raw contains 1.17mg of vitamin B1, cinnamon contains only 0.022mg. These are the specific foods used in this comparison Oat bran, raw and Spices, cinnamon, ground .
Infographic
Mineral Comparison
Mineral comparison score is based on the number of minerals by which one or the other food is richer. The "coverage" charts below show how much of the daily needs can be covered by 300 grams of the food.
7
100 g
300 g
1 cup - 94g
Magnesium
Magnesium
Calcium
Calcium
Potassium
Potassium
Iron
Iron
Copper
Copper
Zinc
Zinc
Phosphorus
Phosphorus
Sodium
Sodium
Manganese
Manganese
Selenium
Selenium
168%
17%
50%
203%
134%
85%
315%
0.52%
734%
247%
3
100 g
300 g
0.25 tsp - 0.5g 1 tbsp - 7.8g
Magnesium
Magnesium
Calcium
Calcium
Potassium
Potassium
Iron
Iron
Copper
Copper
Zinc
Zinc
Phosphorus
Phosphorus
Sodium
Sodium
Manganese
Manganese
Selenium
Selenium
43%
301%
38%
312%
113%
50%
27%
1.3%
2278%
17%
Vitamin Comparison
Vitamin comparison score is based on the number of vitamins by which one or the other food is richer. The "coverage" charts below show how much of the daily needs can be covered by 300 grams of the food.
4
100 g
300 g
1 cup - 94g
Vitamin C
Vit. C
Vitamin D
Vit. D
Vitamin A
Vit. A
Vitamin E
Vit. E
Vitamin B1
Vit. B1
Vitamin B2
Vit. B2
Vitamin B3
Vit. B3
Vitamin B5
Vit. B5
Vitamin B6
Vit. B6
Vitamin B12
Vit. B12
Vitamin K
Vit. K
Folate
Folate
0%
0%
0%
20%
293%
51%
18%
90%
38%
0%
8%
39%
5
100 g
300 g
0.25 tsp - 0.5g 1 tbsp - 7.8g
Vitamin C
Vit. C
Vitamin D
Vit. D
Vitamin A
Vit. A
Vitamin E
Vit. E
Vitamin B1
Vit. B1
Vitamin B2
Vit. B2
Vitamin B3
Vit. B3
Vitamin B5
Vit. B5
Vitamin B6
Vit. B6
Vitamin B12
Vit. B12
Vitamin K
Vit. K
Folate
Folate
13%
0%
5%
46%
5.5%
9.5%
25%
21%
36%
0%
78%
4.5%
All nutrients comparison - raw data values
Nutrient
DV% diff.
Manganese
5.63mg
17.466mg
515%
Fiber
15.4g
53.1g
151%
Phosphorus
734mg
64mg
96%
Vitamin B1
1.17mg
0.022mg
96%
Calcium
58mg
1002mg
94%
Selenium
45.2µg
3.1µg
77%
Magnesium
235mg
60mg
42%
Iron
5.41mg
8.32mg
36%
Protein
17.3g
3.99g
27%
Vitamin B5
1.494mg
0.358mg
23%
Vitamin K
3.2µg
31.2µg
23%
Polyunsaturated fat
2.766g
0.068g
18%
Vitamin B2
0.22mg
0.041mg
14%
Zinc
3.11mg
1.83mg
12%
Folate
52µg
6µg
12%
Fats
7.03g
1.24g
9%
Vitamin E
1.01mg
2.32mg
9%
Copper
0.403mg
0.339mg
7%
Carbs
66.22g
80.59g
5%
Monounsaturated fat
2.376g
0.246g
5%
Vitamin C
0mg
3.8mg
4%
Potassium
566mg
431mg
4%
Choline
32.2mg
11mg
4%
Saturated fat
1.328g
0.345g
4%
Vitamin A
0µg
15µg
2%
Vitamin B3
0.934mg
1.332mg
2%
Vitamin B6
0.165mg
0.158mg
1%
Fructose
1.11g
1%
Calories
246kcal
247kcal
0%
Protein per 100 calories
7g
1.6g
N/A
Calories per 10 g protein
142kcal
619kcal
N/A
Weight per 100 calories
41g
40g
N/A
Unsaturated / Saturated Fat ratio
3.9
0.91
N/A
Net carbs
50.82g
27.49g
N/A
Sugar
1.45g
2.17g
N/A
Sodium
4mg
10mg
0%
Tryptophan
0.335mg
0.049mg
0%
Threonine
0.502mg
0.136mg
0%
Isoleucine
0.668mg
0.146mg
0%
Leucine
1.374mg
0.253mg
0%
Lysine
0.76mg
0.243mg
0%
Methionine
0.335mg
0.078mg
0%
Phenylalanine
0.908mg
0.146mg
0%
Valine
0.964mg
0.224mg
0%
Histidine
0.41mg
0.117mg
0%
Omega-3 - ALA
0.011g
N/A
Macronutrient Comparison
Macronutrient breakdown side-by-side comparison
2
17%
7%
66%
7%
3%
Protein:
17.3 g
Fats:
7.03 g
Carbs:
66.22 g
Water:
6.55 g
Other:
2.9 g
3
4%
81%
11%
4%
Protein:
3.99 g
Fats:
1.24 g
Carbs:
80.59 g
Water:
10.58 g
Other:
3.6 g
Contains
more
Protein Protein
+333.6%
Contains
more
Fats Fats
+466.9%
Contains
more
Carbs Carbs
+21.7%
Contains
more
Water Water
+61.5%
Contains
more
Other Other
+24.1%
Fat Type Comparison
Fat type breakdown side-by-side comparison
2
21%
37%
43%
Saturated fat:
Sat. Fat
1.328 g
Monounsaturated fat:
Mono. Fat
2.376 g
Polyunsaturated fat:
Poly. Fat
2.766 g
1
52%
37%
10%
Saturated fat:
Sat. Fat
0.345 g
Monounsaturated fat:
Mono. Fat
0.246 g
Polyunsaturated fat:
Poly. Fat
0.068 g
Contains
more
Mono. Fat Monounsaturated fat
+865.9%
Contains
more
Poly. Fat Polyunsaturated fat
+3967.6%
Contains
less
Sat. Fat Saturated fat
-74%