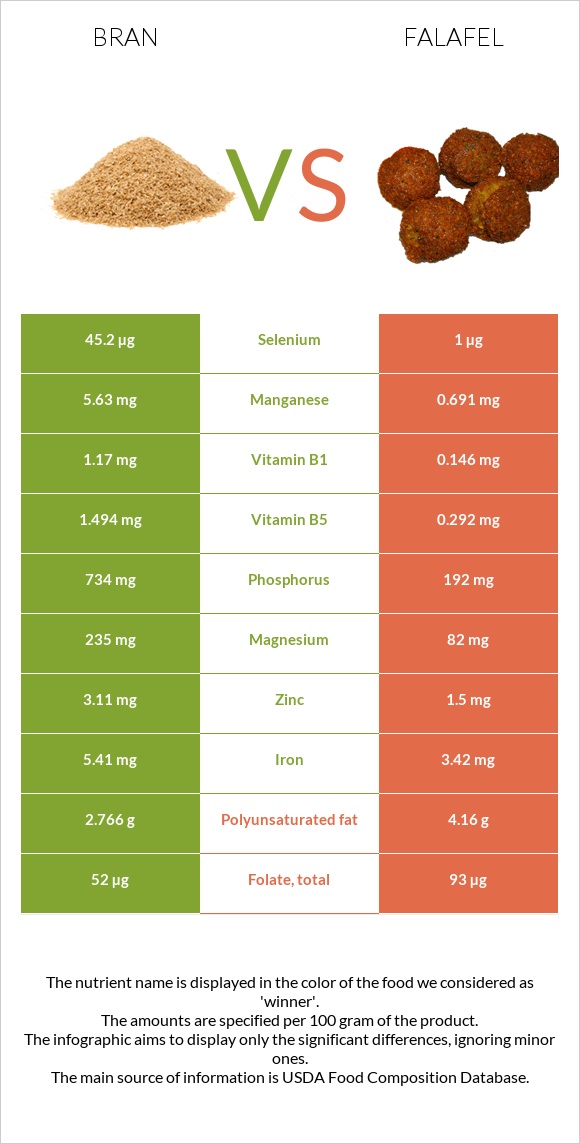
Important differences between bran and falafel Bran has more selenium and manganese; however, falafel has more iron, folate, copper, potassium, phosphorus, and vitamin B2. Falafel's daily need coverage for iron is 32% more. Bran has 8 times more selenium than falafel. Bran has 7.7µg of selenium, while falafel has 1µg. Bran is lower in saturated fat. Bran has a higher glycemic index than falafel. The food varieties used in the comparison are Oat bran, cooked and Falafel, home-prepared .
Infographic
Mineral Comparison
Mineral comparison score is based on the number of minerals by which one or the other food is richer. The "coverage" charts below show how much of the daily needs can be covered by 300 grams of the food.
3
100 g
300 g
1 cup - 219g
Magnesium
Magnesium
Calcium
Calcium
Potassium
Potassium
Iron
Iron
Copper
Copper
Zinc
Zinc
Phosphorus
Phosphorus
Sodium
Sodium
Manganese
Manganese
Selenium
Selenium
29%
3%
8.1%
33%
22%
14%
51%
0.13%
126%
42%
7
100 g
300 g
1 patty (approx 2-1/4" dia) - 17g
Magnesium
Magnesium
Calcium
Calcium
Potassium
Potassium
Iron
Iron
Copper
Copper
Zinc
Zinc
Phosphorus
Phosphorus
Sodium
Sodium
Manganese
Manganese
Selenium
Selenium
59%
16%
52%
128%
86%
41%
82%
38%
90%
5.5%
Vitamin Comparison
Vitamin comparison score is based on the number of vitamins by which one or the other food is richer. The "coverage" charts below show how much of the daily needs can be covered by 300 grams of the food.
0
100 g
300 g
1 cup - 219g
Vitamin C
Vit. C
Vitamin D
Vit. D
Vitamin A
Vit. A
Vitamin E
Vit. E
Vitamin B1
Vit. B1
Vitamin B2
Vit. B2
Vitamin B3
Vit. B3
Vitamin B5
Vit. B5
Vitamin B6
Vit. B6
Vitamin B12
Vit. B12
Vitamin K
Vit. K
Folate
Folate
0%
0%
0%
0%
40%
7.8%
2.7%
13%
5.8%
0%
0%
4.5%
7
100 g
300 g
1 patty (approx 2-1/4" dia) - 17g
Vitamin C
Vit. C
Vitamin D
Vit. D
Vitamin A
Vit. A
Vitamin E
Vit. E
Vitamin B1
Vit. B1
Vitamin B2
Vit. B2
Vitamin B3
Vit. B3
Vitamin B5
Vit. B5
Vitamin B6
Vit. B6
Vitamin B12
Vit. B12
Vitamin K
Vit. K
Folate
Folate
5.3%
0%
0.33%
0%
37%
38%
20%
18%
29%
0%
0%
70%
All nutrients comparison - raw data values
Nutrient
DV% diff.
Iron
0.88mg
3.42mg
32%
Fats
0.86g
17.8g
26%
Monounsaturated fat
0.291g
10.171g
25%
Polyunsaturated fat
0.339g
4.16g
25%
Folate
6µg
93µg
22%
Copper
0.066mg
0.258mg
21%
Protein
3.21g
13.31g
20%
Calories
40kcal
333kcal
15%
Potassium
92mg
585mg
15%
Sodium
1mg
294mg
13%
Manganese
0.964mg
0.691mg
12%
Selenium
7.7µg
1µg
12%
Magnesium
40mg
82mg
10%
Fiber
2.6g
10%
Phosphorus
119mg
192mg
10%
Vitamin B2
0.034mg
0.166mg
10%
Saturated fat
0.163g
2.383g
10%
Zinc
0.53mg
1.5mg
9%
Vitamin B6
0.025mg
0.125mg
8%
Carbs
11.44g
31.84g
7%
Vitamin B3
0.144mg
1.044mg
6%
Calcium
10mg
54mg
4%
Vitamin C
0mg
1.6mg
2%
Vitamin B5
0.217mg
0.292mg
2%
Vitamin B1
0.16mg
0.146mg
1%
Protein per 100 calories
8g
4g
N/A
Calories per 10 g protein
125kcal
250kcal
N/A
Weight per 100 calories
250g
30g
N/A
Unsaturated / Saturated Fat ratio
3.9
6
N/A
Net carbs
8.84g
31.84g
N/A
Vitamin A
0µg
1µg
0%
Tryptophan
0.057mg
0.134mg
0%
Threonine
0.086mg
0.492mg
0%
Isoleucine
0.114mg
0.567mg
0%
Leucine
0.235mg
0.944mg
0%
Lysine
0.13mg
0.856mg
0%
Methionine
0.057mg
0.187mg
0%
Phenylalanine
0.155mg
0.707mg
0%
Valine
0.165mg
0.562mg
0%
Histidine
0.07mg
0.364mg
0%
Macronutrient Comparison
Macronutrient breakdown side-by-side comparison
1
3%
11%
84%
Protein:
3.21 g
Fats:
0.86 g
Carbs:
11.44 g
Water:
84 g
Other:
0.49 g
4
13%
18%
32%
35%
2%
Protein:
13.31 g
Fats:
17.8 g
Carbs:
31.84 g
Water:
34.62 g
Other:
2.43 g
Contains
more
Water Water
+142.6%
Contains
more
Protein Protein
+314.6%
Contains
more
Fats Fats
+1969.8%
Contains
more
Carbs Carbs
+178.3%
Contains
more
Other Other
+395.9%
Fat Type Comparison
Fat type breakdown side-by-side comparison
1
21%
37%
43%
Saturated fat:
Sat. Fat
0.163 g
Monounsaturated fat:
Mono. Fat
0.291 g
Polyunsaturated fat:
Poly. Fat
0.339 g
2
14%
61%
25%
Saturated fat:
Sat. Fat
2.383 g
Monounsaturated fat:
Mono. Fat
10.171 g
Polyunsaturated fat:
Poly. Fat
4.16 g
Contains
less
Sat. Fat Saturated fat
-93.2%
Contains
more
Mono. Fat Monounsaturated fat
+3395.2%
Contains
more
Poly. Fat Polyunsaturated fat
+1127.1%