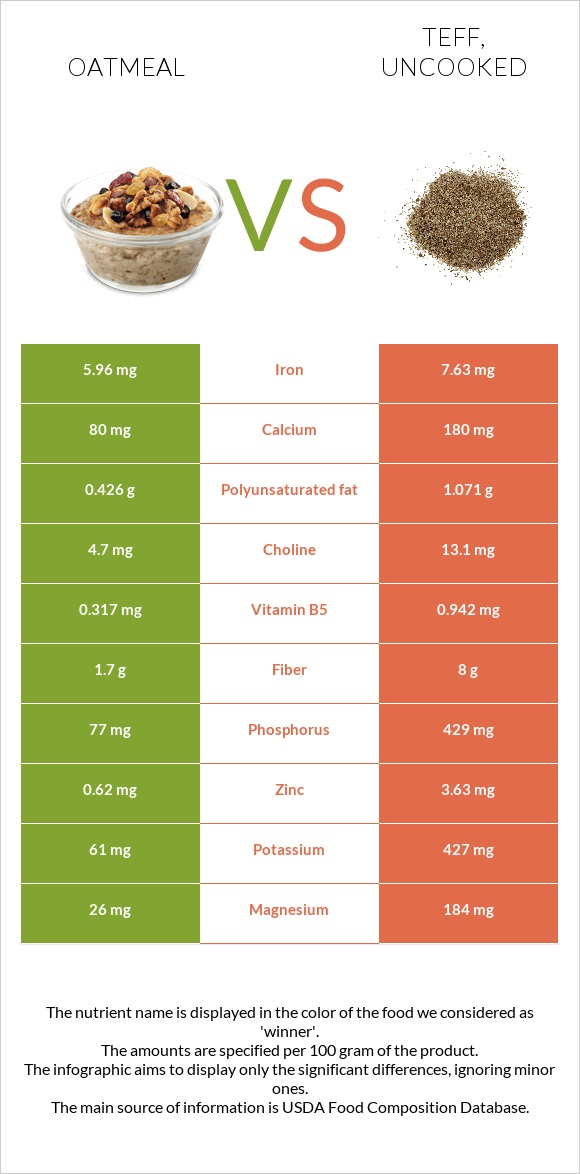
A recap on the differences between oatmeal and teff Oatmeal has less manganese, copper, phosphorus, magnesium, zinc, fiber, iron, vitamin B6, vitamin B5, and vitamin B1. Teff covers your daily manganese needs 377% more than oatmeal. Food varieties used in this article are Cereals, oats, instant, fortified, plain, prepared with water (boiling water added or microwaved) and Teff, uncooked .
Infographic
Mineral Comparison
Mineral comparison score is based on the number of minerals by which one or the other food is richer. The "coverage" charts below show how much of the daily needs can be covered by 300 grams of the food.
1
100 g
300 g
1 oz, dry, yields - 177g 1 packet, dry, yields - 177g 1 cup, cooked - 234g 1 cup, dry, yields - 501g
Magnesium
Magnesium
Calcium
Calcium
Potassium
Potassium
Iron
Iron
Copper
Copper
Zinc
Zinc
Phosphorus
Phosphorus
Sodium
Sodium
Manganese
Manganese
Selenium
Selenium
19%
24%
5.4%
224%
22%
17%
33%
6.4%
73%
27%
9
100 g
300 g
1 cup - 193g
Magnesium
Magnesium
Calcium
Calcium
Potassium
Potassium
Iron
Iron
Copper
Copper
Zinc
Zinc
Phosphorus
Phosphorus
Sodium
Sodium
Manganese
Manganese
Selenium
Selenium
131%
54%
38%
286%
270%
99%
184%
1.6%
1205%
24%
Vitamin Comparison
Vitamin comparison score is based on the number of vitamins by which one or the other food is richer. The "coverage" charts below show how much of the daily needs can be covered by 300 grams of the food.
2
100 g
300 g
1 oz, dry, yields - 177g 1 packet, dry, yields - 177g 1 cup, cooked - 234g 1 cup, dry, yields - 501g
Vitamin C
Vit. C
Vitamin D
Vit. D
Vitamin A
Vit. A
Vitamin E
Vit. E
Vitamin B1
Vit. B1
Vitamin B2
Vit. B2
Vitamin B3
Vit. B3
Vitamin B5
Vit. B5
Vitamin B6
Vit. B6
Vitamin B12
Vit. B12
Vitamin K
Vit. K
Folate
Folate
0%
0%
43%
1.4%
65%
50%
57%
19%
67%
0%
1%
33%
7
100 g
300 g
1 cup - 193g
Vitamin C
Vit. C
Vitamin D
Vit. D
Vitamin A
Vit. A
Vitamin E
Vit. E
Vitamin B1
Vit. B1
Vitamin B2
Vit. B2
Vitamin B3
Vit. B3
Vitamin B5
Vit. B5
Vitamin B6
Vit. B6
Vitamin B12
Vit. B12
Vitamin K
Vit. K
Folate
Folate
0%
0%
0%
1.6%
98%
62%
63%
57%
111%
0%
4.8%
0%
All nutrients comparison - raw data values
Nutrient
DV% diff.
Manganese
0.558mg
9.24mg
377%
Copper
0.066mg
0.81mg
83%
Phosphorus
77mg
429mg
50%
Magnesium
26mg
184mg
38%
Zinc
0.62mg
3.63mg
27%
Fiber
1.7g
8g
25%
Protein
2.37g
13.3g
22%
Iron
5.96mg
7.63mg
21%
Carbs
11.67g
73.13g
20%
Calories
68kcal
367kcal
15%
Vitamin B6
0.29mg
0.482mg
15%
Vitamin A
130µg
0µg
14%
Vitamin B5
0.317mg
0.942mg
13%
Potassium
61mg
427mg
11%
Starch
10.37g
36.56g
11%
Vitamin B1
0.26mg
0.39mg
11%
Folate
44µg
11%
Calcium
80mg
180mg
10%
Vitamin B2
0.215mg
0.27mg
4%
Polyunsaturated fat
0.426g
1.071g
4%
Fats
1.36g
2.38g
2%
Sodium
49mg
12mg
2%
Vitamin B3
3.025mg
3.363mg
2%
Choline
4.7mg
13.1mg
2%
Selenium
5µg
4.4µg
1%
Vitamin K
0.4µg
1.9µg
1%
Saturated fat
0.226g
0.449g
1%
Fructose
0g
0.47g
1%
Protein per 100 calories
3.5g
3.6g
N/A
Calories per 10 g protein
287kcal
276kcal
N/A
Weight per 100 calories
147g
27g
N/A
Unsaturated / Saturated Fat ratio
3.6
3.7
N/A
Net carbs
9.97g
65.13g
N/A
Sugar
0.46g
1.84g
N/A
Vitamin E
0.07mg
0.08mg
0%
Trans fat
0.003g
N/A
Monounsaturated fat
0.391g
0.589g
0%
Tryptophan
0.04mg
0.139mg
0%
Threonine
0.083mg
0.51mg
0%
Isoleucine
0.105mg
0.501mg
0%
Leucine
0.2mg
1.068mg
0%
Lysine
0.135mg
0.376mg
0%
Methionine
0.04mg
0.428mg
0%
Phenylalanine
0.13mg
0.698mg
0%
Valine
0.151mg
0.686mg
0%
Histidine
0.057mg
0.301mg
0%
Omega-3 - ALA
0.135g
N/A
Macronutrient Comparison
Macronutrient breakdown side-by-side comparison
1
2%
12%
84%
Protein:
2.37 g
Fats:
1.36 g
Carbs:
11.67 g
Water:
84.03 g
Other:
0.57 g
4
13%
2%
73%
9%
2%
Protein:
13.3 g
Fats:
2.38 g
Carbs:
73.13 g
Water:
8.82 g
Other:
2.37 g
Contains
more
Water Water
+852.7%
Contains
more
Protein Protein
+461.2%
Contains
more
Fats Fats
+75%
Contains
more
Carbs Carbs
+526.6%
Contains
more
Other Other
+315.8%
Fat Type Comparison
Fat type breakdown side-by-side comparison
1
22%
37%
41%
Saturated fat:
Sat. Fat
0.226 g
Monounsaturated fat:
Mono. Fat
0.391 g
Polyunsaturated fat:
Poly. Fat
0.426 g
2
21%
28%
51%
Saturated fat:
Sat. Fat
0.449 g
Monounsaturated fat:
Mono. Fat
0.589 g
Polyunsaturated fat:
Poly. Fat
1.071 g
Contains
less
Sat. Fat Saturated fat
-49.7%
Contains
more
Mono. Fat Monounsaturated fat
+50.6%
Contains
more
Poly. Fat Polyunsaturated fat
+151.4%
Carbohydrate type comparison
Carbohydrate type breakdown side-by-side comparison
1
96%
3%
Starch:
10.37 g
Sucrose:
0.29 g
Glucose:
0 g
Fructose:
0 g
Lactose:
0 g
Maltose:
0 g
Galactose:
0.16 g
5
95%
2%
Starch:
36.56 g
Sucrose:
0.62 g
Glucose:
0.73 g
Fructose:
0.47 g
Lactose:
0 g
Maltose:
0.01 g
Galactose:
0 g
Contains
more
Galactose Galactose
+∞%
Contains
more
Starch Starch
+252.6%
Contains
more
Sucrose Sucrose
+113.8%
Contains
more
Glucose Glucose
+∞%
Contains
more
Fructose Fructose
+∞%
Contains
more
Maltose Maltose
+∞%