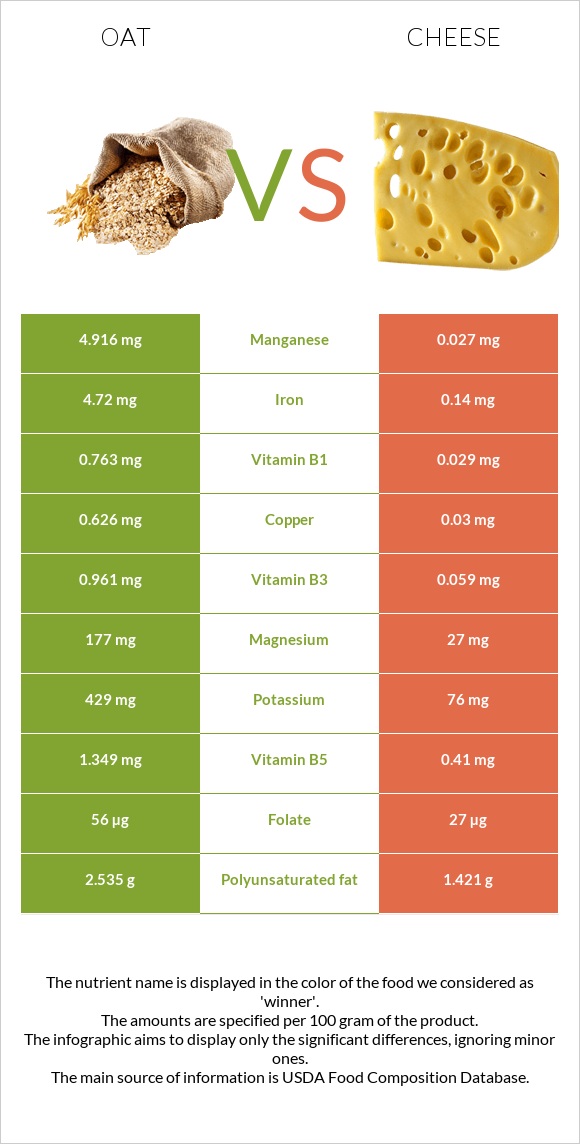
What are the differences between oats and cheese? Oats are higher in manganese, copper, vitamin B1, iron, fiber, and magnesium; however, cheese is richer in calcium and vitamin B12. Oats' daily need coverage for manganese is 213% more. Oats have less saturated fat. Cheese has a lower glycemic index (0) than oats (59). We used Oats and Cheese, cheddar types in this article.
Infographic
Mineral Comparison
Mineral comparison score is based on the number of minerals by which one or the other food is richer. The "coverage" charts below show how much of the daily needs can be covered by 300 grams of the food.
7
100 g
300 g
1 cup - 156g
Magnesium
Magnesium
Calcium
Calcium
Potassium
Potassium
Iron
Iron
Copper
Copper
Zinc
Zinc
Phosphorus
Phosphorus
Sodium
Sodium
Manganese
Manganese
Selenium
Selenium
126%
16%
38%
177%
209%
108%
224%
0.26%
641%
0%
2
100 g
300 g
1 cubic inch - 17g 1 slice (1 oz) - 28g 1 oz - 28.35g 1 cup, shredded - 113g 1 cup, diced - 132g 1 cup, melted - 244g
Magnesium
Magnesium
Calcium
Calcium
Potassium
Potassium
Iron
Iron
Copper
Copper
Zinc
Zinc
Phosphorus
Phosphorus
Sodium
Sodium
Manganese
Manganese
Selenium
Selenium
19%
213%
6.7%
5.3%
10%
99%
195%
85%
3.5%
155%
Vitamin Comparison
Vitamin comparison score is based on the number of vitamins by which one or the other food is richer. The "coverage" charts below show how much of the daily needs can be covered by 300 grams of the food.
5
100 g
300 g
1 cup - 156g
Vitamin C
Vit. C
Vitamin D
Vit. D
Vitamin A
Vit. A
Vitamin E
Vit. E
Vitamin B1
Vit. B1
Vitamin B2
Vit. B2
Vitamin B3
Vit. B3
Vitamin B5
Vit. B5
Vitamin B6
Vit. B6
Vitamin B12
Vit. B12
Vitamin K
Vit. K
Folate
Folate
0%
0%
0%
0%
191%
32%
18%
81%
27%
0%
0%
42%
6
100 g
300 g
1 cubic inch - 17g 1 slice (1 oz) - 28g 1 oz - 28.35g 1 cup, shredded - 113g 1 cup, diced - 132g 1 cup, melted - 244g
Vitamin C
Vit. C
Vitamin D
Vit. D
Vitamin A
Vit. A
Vitamin E
Vit. E
Vitamin B1
Vit. B1
Vitamin B2
Vit. B2
Vitamin B3
Vit. B3
Vitamin B5
Vit. B5
Vitamin B6
Vit. B6
Vitamin B12
Vit. B12
Vitamin K
Vit. K
Folate
Folate
0%
9%
110%
14%
7.3%
99%
1.1%
25%
15%
138%
6%
20%
All nutrients comparison - raw data values
Nutrient
DV% diff.
Manganese
4.916mg
0.027mg
213%
Saturated fat
1.217g
18.867g
80%
Calcium
54mg
710mg
66%
Copper
0.626mg
0.03mg
66%
Vitamin B1
0.763mg
0.029mg
61%
Iron
4.72mg
0.14mg
57%
Selenium
28.5µg
52%
Vitamin B12
0µg
1.1µg
46%
Fiber
10.6g
0g
42%
Fats
6.9g
33.31g
41%
Vitamin A
0µg
330µg
37%
Magnesium
177mg
27mg
36%
Cholesterol
0mg
99mg
33%
Sodium
2mg
653mg
28%
Vitamin B2
0.139mg
0.428mg
22%
Carbs
66.27g
3.09g
21%
Vitamin B5
1.349mg
0.41mg
19%
Monounsaturated fat
2.178g
9.246g
18%
Protein
16.89g
22.87g
12%
Potassium
429mg
76mg
10%
Phosphorus
523mg
455mg
10%
Folate
56µg
27µg
7%
Polyunsaturated fat
2.535g
1.421g
7%
Vitamin B3
0.961mg
0.059mg
6%
Vitamin E
0.71mg
5%
Vitamin B6
0.119mg
0.066mg
4%
Vitamin D*
0 IU
24 IU
3%
Vitamin D
0µg
0.6µg
3%
Zinc
3.97mg
3.64mg
3%
Choline
16.5mg
3%
Vitamin K
2.4µg
2%
Calories
389kcal
404kcal
1%
Protein per 100 calories
4.3g
5.7g
N/A
Calories per 10 g protein
230kcal
177kcal
N/A
Weight per 100 calories
26g
25g
N/A
Unsaturated / Saturated Fat ratio
3.9
0.57
N/A
Net carbs
55.67g
3.09g
N/A
Sugar
0.48g
N/A
Trans fat
0.917g
N/A
Tryptophan
0.234mg
0.547mg
0%
Threonine
0.575mg
1.044mg
0%
Isoleucine
0.694mg
1.206mg
0%
Leucine
1.284mg
1.939mg
0%
Lysine
0.701mg
1.025mg
0%
Methionine
0.312mg
0.547mg
0%
Phenylalanine
0.895mg
1.074mg
0%
Valine
0.937mg
1.404mg
0%
Histidine
0.405mg
0.547mg
0%
Omega-3 - EPA
0.01g
N/A
Omega-3 - DHA
0.001g
N/A
Omega-3 - DPA
0.017g
N/A
Omega-6 - Eicosadienoic acid
0.007g
N/A
Macronutrient Comparison
Macronutrient breakdown side-by-side comparison
1
17%
7%
66%
8%
2%
Protein:
16.89 g
Fats:
6.9 g
Carbs:
66.27 g
Water:
8.22 g
Other:
1.72 g
4
23%
33%
3%
37%
4%
Protein:
22.87 g
Fats:
33.31 g
Carbs:
3.09 g
Water:
37.02 g
Other:
3.71 g
Contains
more
Carbs Carbs
+2044.7%
Contains
more
Protein Protein
+35.4%
Contains
more
Fats Fats
+382.8%
Contains
more
Water Water
+350.4%
Contains
more
Other Other
+115.7%
Fat Type Comparison
Fat type breakdown side-by-side comparison
2
21%
37%
43%
Saturated fat:
Sat. Fat
1.217 g
Monounsaturated fat:
Mono. Fat
2.178 g
Polyunsaturated fat:
Poly. Fat
2.535 g
1
64%
31%
5%
Saturated fat:
Sat. Fat
18.867 g
Monounsaturated fat:
Mono. Fat
9.246 g
Polyunsaturated fat:
Poly. Fat
1.421 g
Contains
less
Sat. Fat Saturated fat
-93.5%
Contains
more
Poly. Fat Polyunsaturated fat
+78.4%
Contains
more
Mono. Fat Monounsaturated fat
+324.5%