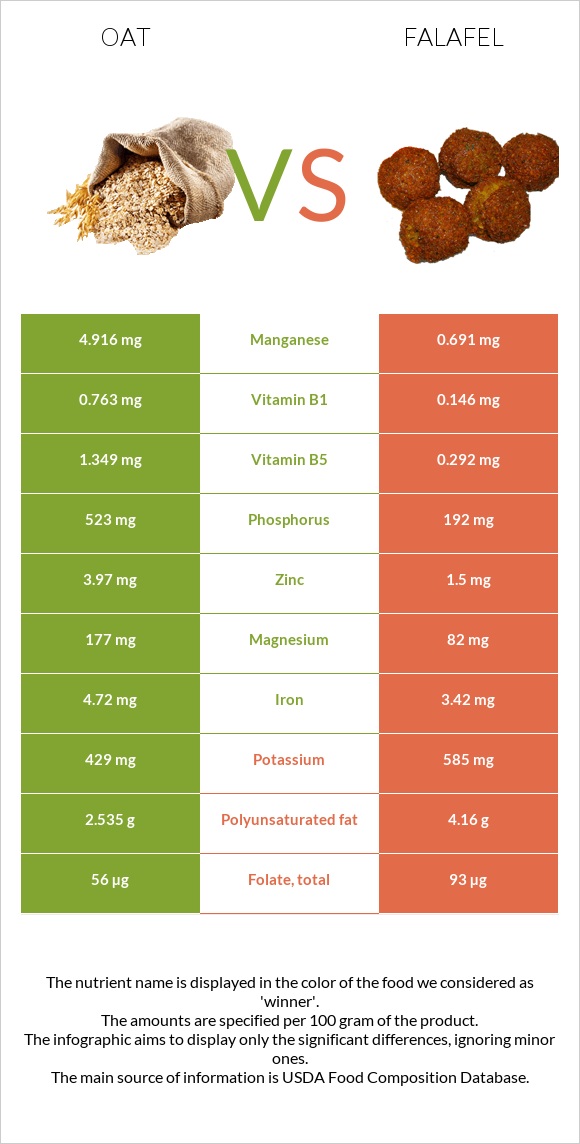
What are the main differences between oats and falafel? Oats are richer in manganese, vitamin B1, phosphorus, copper, magnesium, zinc, vitamin B5, and iron, while falafel is higher in folate. Oats' daily need coverage for manganese is 184% higher. Falafel has 5 times less vitamin B1 than oats. Oats have 0.763mg of vitamin B1, while falafel has 0.146mg. Oats are lower in sodium. Oats have a higher glycemic index (59) than falafel (33). We used Oats and Falafel, home-prepared types in this comparison.
Infographic
Mineral Comparison
Mineral comparison score is based on the number of minerals by which one or the other food is richer. The "coverage" charts below show how much of the daily needs can be covered by 300 grams of the food.
7
100 g
300 g
1 cup - 156g
Magnesium
Magnesium
Calcium
Calcium
Potassium
Potassium
Iron
Iron
Copper
Copper
Zinc
Zinc
Phosphorus
Phosphorus
Sodium
Sodium
Manganese
Manganese
Selenium
Selenium
126%
16%
38%
177%
209%
108%
224%
0.26%
641%
0%
2
100 g
300 g
1 patty (approx 2-1/4" dia) - 17g
Magnesium
Magnesium
Calcium
Calcium
Potassium
Potassium
Iron
Iron
Copper
Copper
Zinc
Zinc
Phosphorus
Phosphorus
Sodium
Sodium
Manganese
Manganese
Selenium
Selenium
59%
16%
52%
128%
86%
41%
82%
38%
90%
5.5%
Vitamin Comparison
Vitamin comparison score is based on the number of vitamins by which one or the other food is richer. The "coverage" charts below show how much of the daily needs can be covered by 300 grams of the food.
2
100 g
300 g
1 cup - 156g
Vitamin C
Vit. C
Vitamin D
Vit. D
Vitamin A
Vit. A
Vitamin E
Vit. E
Vitamin B1
Vit. B1
Vitamin B2
Vit. B2
Vitamin B3
Vit. B3
Vitamin B5
Vit. B5
Vitamin B6
Vit. B6
Vitamin B12
Vit. B12
Vitamin K
Vit. K
Folate
Folate
0%
0%
0%
0%
191%
32%
18%
81%
27%
0%
0%
42%
4
100 g
300 g
1 patty (approx 2-1/4" dia) - 17g
Vitamin C
Vit. C
Vitamin D
Vit. D
Vitamin A
Vit. A
Vitamin E
Vit. E
Vitamin B1
Vit. B1
Vitamin B2
Vit. B2
Vitamin B3
Vit. B3
Vitamin B5
Vit. B5
Vitamin B6
Vit. B6
Vitamin B12
Vit. B12
Vitamin K
Vit. K
Folate
Folate
5.3%
0%
0.33%
0%
37%
38%
20%
18%
29%
0%
0%
70%
All nutrients comparison - raw data values
Nutrient
DV% diff.
Manganese
4.916mg
0.691mg
184%
Vitamin B1
0.763mg
0.146mg
51%
Phosphorus
523mg
192mg
47%
Fiber
10.6g
42%
Copper
0.626mg
0.258mg
41%
Magnesium
177mg
82mg
23%
Zinc
3.97mg
1.5mg
22%
Vitamin B5
1.349mg
0.292mg
21%
Monounsaturated fat
2.178g
10.171g
20%
Fats
6.9g
17.8g
17%
Iron
4.72mg
3.42mg
16%
Sodium
2mg
294mg
13%
Carbs
66.27g
31.84g
11%
Polyunsaturated fat
2.535g
4.16g
11%
Folate
56µg
93µg
9%
Protein
16.89g
13.31g
7%
Potassium
429mg
585mg
5%
Saturated fat
1.217g
2.383g
5%
Calories
389kcal
333kcal
3%
Vitamin C
0mg
1.6mg
2%
Selenium
1µg
2%
Vitamin B2
0.139mg
0.166mg
2%
Vitamin B3
0.961mg
1.044mg
1%
Protein per 100 calories
4.3g
4g
N/A
Calories per 10 g protein
230kcal
250kcal
N/A
Weight per 100 calories
26g
30g
N/A
Unsaturated / Saturated Fat ratio
3.9
6
N/A
Net carbs
55.67g
31.84g
N/A
Calcium
54mg
54mg
0%
Vitamin A
0µg
1µg
0%
Vitamin B6
0.119mg
0.125mg
0%
Tryptophan
0.234mg
0.134mg
0%
Threonine
0.575mg
0.492mg
0%
Isoleucine
0.694mg
0.567mg
0%
Leucine
1.284mg
0.944mg
0%
Lysine
0.701mg
0.856mg
0%
Methionine
0.312mg
0.187mg
0%
Phenylalanine
0.895mg
0.707mg
0%
Valine
0.937mg
0.562mg
0%
Histidine
0.405mg
0.364mg
0%
Macronutrient Comparison
Macronutrient breakdown side-by-side comparison
2
17%
7%
66%
8%
2%
Protein:
16.89 g
Fats:
6.9 g
Carbs:
66.27 g
Water:
8.22 g
Other:
1.72 g
3
13%
18%
32%
35%
2%
Protein:
13.31 g
Fats:
17.8 g
Carbs:
31.84 g
Water:
34.62 g
Other:
2.43 g
Contains
more
Protein Protein
+26.9%
Contains
more
Carbs Carbs
+108.1%
Contains
more
Fats Fats
+158%
Contains
more
Water Water
+321.2%
Contains
more
Other Other
+41.3%
Fat Type Comparison
Fat type breakdown side-by-side comparison
1
21%
37%
43%
Saturated fat:
Sat. Fat
1.217 g
Monounsaturated fat:
Mono. Fat
2.178 g
Polyunsaturated fat:
Poly. Fat
2.535 g
2
14%
61%
25%
Saturated fat:
Sat. Fat
2.383 g
Monounsaturated fat:
Mono. Fat
10.171 g
Polyunsaturated fat:
Poly. Fat
4.16 g
Contains
less
Sat. Fat Saturated fat
-48.9%
Contains
more
Mono. Fat Monounsaturated fat
+367%
Contains
more
Poly. Fat Polyunsaturated fat
+64.1%