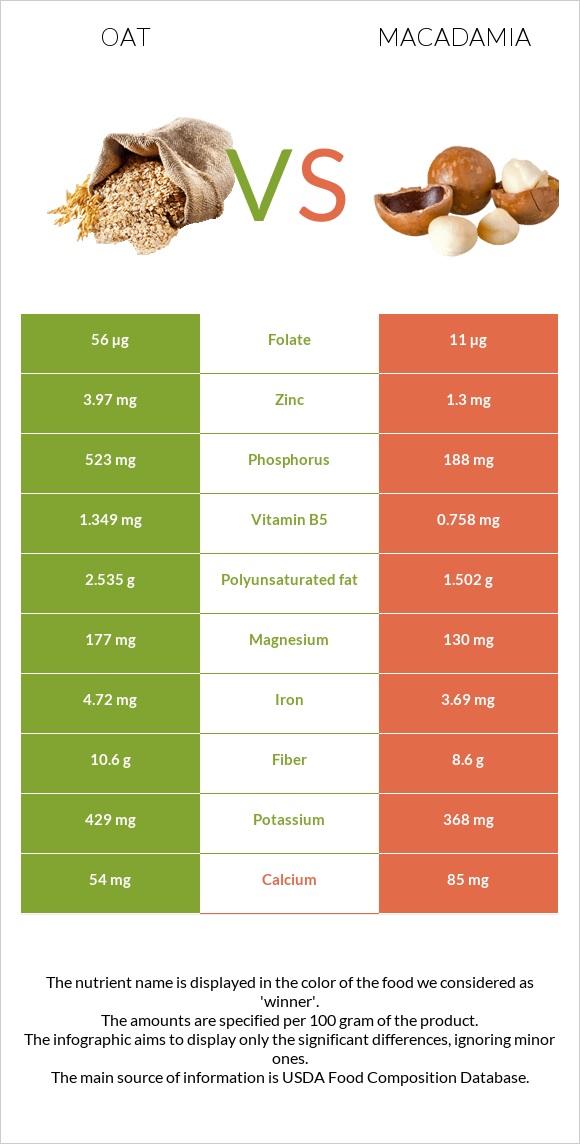
How are oats and macadamia different? Oats are higher in phosphorus, manganese, zinc, iron, vitamin B5, and folate; however, macadamia is richer in vitamin B1, copper, and vitamin B6. Daily need coverage for saturated fat for macadamia is 54% higher. Oats contain 5 times more folate than macadamia. While oats contain 56µg of folate, macadamia contains only 11µg. Oats have less saturated fat. Macadamia has a lower glycemic index (10) than oats (59). Oats and Nuts, macadamia nuts, raw are the varieties used in this article.
Infographic
Mineral Comparison
Mineral comparison score is based on the number of minerals by which one or the other food is richer. The "coverage" charts below show how much of the daily needs can be covered by 300 grams of the food.
7
100 g
300 g
1 cup - 156g
Magnesium
Magnesium
Calcium
Calcium
Potassium
Potassium
Iron
Iron
Copper
Copper
Zinc
Zinc
Phosphorus
Phosphorus
Sodium
Sodium
Manganese
Manganese
Selenium
Selenium
126%
16%
38%
177%
209%
108%
224%
0.26%
641%
0%
3
100 g
300 g
1 oz (10-12 kernels) - 28.35g 1 cup, whole or halves - 134g
Magnesium
Magnesium
Calcium
Calcium
Potassium
Potassium
Iron
Iron
Copper
Copper
Zinc
Zinc
Phosphorus
Phosphorus
Sodium
Sodium
Manganese
Manganese
Selenium
Selenium
93%
26%
32%
138%
252%
35%
81%
0.65%
539%
20%
Vitamin Comparison
Vitamin comparison score is based on the number of vitamins by which one or the other food is richer. The "coverage" charts below show how much of the daily needs can be covered by 300 grams of the food.
2
100 g
300 g
1 cup - 156g
Vitamin C
Vit. C
Vitamin D
Vit. D
Vitamin A
Vit. A
Vitamin E
Vit. E
Vitamin B1
Vit. B1
Vitamin B2
Vit. B2
Vitamin B3
Vit. B3
Vitamin B5
Vit. B5
Vitamin B6
Vit. B6
Vitamin B12
Vit. B12
Vitamin K
Vit. K
Folate
Folate
0%
0%
0%
0%
191%
32%
18%
81%
27%
0%
0%
42%
6
100 g
300 g
1 oz (10-12 kernels) - 28.35g 1 cup, whole or halves - 134g
Vitamin C
Vit. C
Vitamin D
Vit. D
Vitamin A
Vit. A
Vitamin E
Vit. E
Vitamin B1
Vit. B1
Vitamin B2
Vit. B2
Vitamin B3
Vit. B3
Vitamin B5
Vit. B5
Vitamin B6
Vit. B6
Vitamin B12
Vit. B12
Vitamin K
Vit. K
Folate
Folate
4%
0%
0%
11%
299%
37%
46%
45%
63%
0%
0%
8.3%
All nutrients comparison - raw data values
Nutrient
DV% diff.
Monounsaturated fat
2.178g
58.877g
142%
Fats
6.9g
75.77g
106%
Saturated fat
1.217g
12.061g
49%
Phosphorus
523mg
188mg
48%
Vitamin B1
0.763mg
1.195mg
36%
Manganese
4.916mg
4.131mg
34%
Zinc
3.97mg
1.3mg
24%
Protein
16.89g
7.91g
18%
Carbs
66.27g
13.82g
17%
Calories
389kcal
718kcal
16%
Copper
0.626mg
0.756mg
14%
Iron
4.72mg
3.69mg
13%
Vitamin B5
1.349mg
0.758mg
12%
Vitamin B6
0.119mg
0.275mg
12%
Magnesium
177mg
130mg
11%
Folate
56µg
11µg
11%
Vitamin B3
0.961mg
2.473mg
9%
Fiber
10.6g
8.6g
8%
Selenium
3.6µg
7%
Polyunsaturated fat
2.535g
1.502g
7%
Vitamin E
0.54mg
4%
Calcium
54mg
85mg
3%
Potassium
429mg
368mg
2%
Vitamin B2
0.139mg
0.162mg
2%
Vitamin C
0mg
1.2mg
1%
Protein per 100 calories
4.3g
1.1g
N/A
Calories per 10 g protein
230kcal
908kcal
N/A
Weight per 100 calories
26g
14g
N/A
Unsaturated / Saturated Fat ratio
3.9
5
N/A
Net carbs
55.67g
5.22g
N/A
Sugar
4.57g
N/A
Starch
1.05g
0%
Sodium
2mg
5mg
0%
Tryptophan
0.234mg
0.067mg
0%
Threonine
0.575mg
0.37mg
0%
Isoleucine
0.694mg
0.314mg
0%
Leucine
1.284mg
0.602mg
0%
Lysine
0.701mg
0.018mg
0%
Methionine
0.312mg
0.023mg
0%
Phenylalanine
0.895mg
0.665mg
0%
Valine
0.937mg
0.363mg
0%
Histidine
0.405mg
0.195mg
0%
Fructose
0.07g
0%
Macronutrient Comparison
Macronutrient breakdown side-by-side comparison
4
17%
7%
66%
8%
2%
Protein:
16.89 g
Fats:
6.9 g
Carbs:
66.27 g
Water:
8.22 g
Other:
1.72 g
1
8%
76%
14%
Protein:
7.91 g
Fats:
75.77 g
Carbs:
13.82 g
Water:
1.36 g
Other:
1.14 g
Contains
more
Protein Protein
+113.5%
Contains
more
Carbs Carbs
+379.5%
Contains
more
Water Water
+504.4%
Contains
more
Other Other
+50.9%
Contains
more
Fats Fats
+998.1%
Fat Type Comparison
Fat type breakdown side-by-side comparison
2
21%
37%
43%
Saturated fat:
Sat. Fat
1.217 g
Monounsaturated fat:
Mono. Fat
2.178 g
Polyunsaturated fat:
Poly. Fat
2.535 g
1
17%
81%
2%
Saturated fat:
Sat. Fat
12.061 g
Monounsaturated fat:
Mono. Fat
58.877 g
Polyunsaturated fat:
Poly. Fat
1.502 g
Contains
less
Sat. Fat Saturated fat
-89.9%
Contains
more
Poly. Fat Polyunsaturated fat
+68.8%
Contains
more
Mono. Fat Monounsaturated fat
+2603.3%