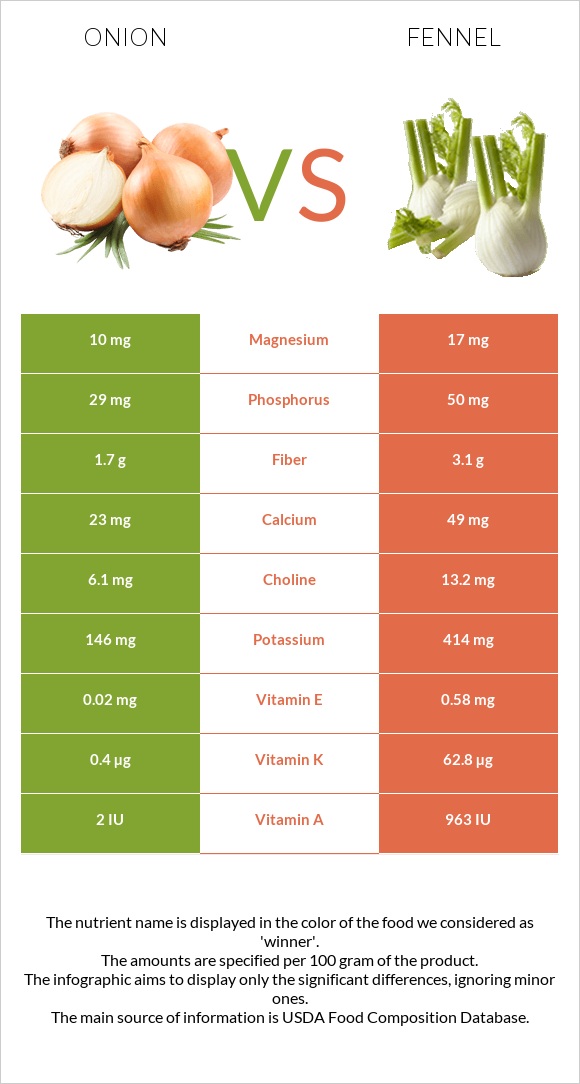
How are onions and fennel different? Onions are higher in vitamin B6; however, fennel is richer in vitamin K, vitamin A, potassium, iron, fiber, and vitamin C. Daily need coverage for vitamin K for fennel is 52% higher. Onions contain 3 times more vitamin B6 than fennel. While onions contain 0.12mg of vitamin B6, fennel contains only 0.047mg. Onions have a lower glycemic index (15) than fennel (45). Onions, raw and Fennel, bulb, raw are the varieties used in this article.
Infographic
Mineral Comparison
Mineral comparison score is based on the number of minerals by which one or the other food is richer. The "coverage" charts below show how much of the daily needs can be covered by 300 grams of the food.
1
100 g
300 g
1 slice, thin - 9g 1 tbsp chopped - 10g 1 slice, medium (1/8" thick) - 14g 1 slice, large (1/4" thick) - 38g 10 rings - 60g 1 small - 70g 1 medium (2-1/2" dia) - 110g 1 cup, sliced - 115g 1 large - 150g 1 cup, chopped - 160g
Magnesium
Magnesium
Calcium
Calcium
Potassium
Potassium
Iron
Iron
Copper
Copper
Zinc
Zinc
Phosphorus
Phosphorus
Sodium
Sodium
Manganese
Manganese
Selenium
Selenium
7.1%
6.9%
13%
7.9%
13%
4.6%
12%
0.52%
17%
2.7%
9
100 g
300 g
1 cup, sliced - 87g 1 bulb - 234g
Magnesium
Magnesium
Calcium
Calcium
Potassium
Potassium
Iron
Iron
Copper
Copper
Zinc
Zinc
Phosphorus
Phosphorus
Sodium
Sodium
Manganese
Manganese
Selenium
Selenium
12%
15%
37%
27%
22%
5.5%
21%
6.8%
25%
3.8%
Vitamin Comparison
Vitamin comparison score is based on the number of vitamins by which one or the other food is richer. The "coverage" charts below show how much of the daily needs can be covered by 300 grams of the food.
2
100 g
300 g
1 slice, thin - 9g 1 tbsp chopped - 10g 1 slice, medium (1/8" thick) - 14g 1 slice, large (1/4" thick) - 38g 10 rings - 60g 1 small - 70g 1 medium (2-1/2" dia) - 110g 1 cup, sliced - 115g 1 large - 150g 1 cup, chopped - 160g
Vitamin C
Vit. C
Vitamin D
Vit. D
Vitamin A
Vit. A
Vitamin E
Vit. E
Vitamin B1
Vit. B1
Vitamin B2
Vit. B2
Vitamin B3
Vit. B3
Vitamin B5
Vit. B5
Vitamin B6
Vit. B6
Vitamin B12
Vit. B12
Vitamin K
Vit. K
Folate
Folate
25%
0%
0%
0.4%
12%
6.2%
2.2%
7.4%
28%
0%
1%
14%
8
100 g
300 g
1 cup, sliced - 87g 1 bulb - 234g
Vitamin C
Vit. C
Vitamin D
Vit. D
Vitamin A
Vit. A
Vitamin E
Vit. E
Vitamin B1
Vit. B1
Vitamin B2
Vit. B2
Vitamin B3
Vit. B3
Vitamin B5
Vit. B5
Vitamin B6
Vit. B6
Vitamin B12
Vit. B12
Vitamin K
Vit. K
Folate
Folate
40%
0%
16%
12%
2.5%
7.4%
12%
14%
11%
0%
157%
20%
All nutrients comparison - raw data values
Nutrient
DV% diff.
Vitamin K
0.4µg
62.8µg
52%
Potassium
146mg
414mg
8%
Iron
0.21mg
0.73mg
7%
Fiber
1.7g
3.1g
6%
Vitamin B6
0.12mg
0.047mg
6%
Vitamin C
7.4mg
12mg
5%
Vitamin A
0µg
48µg
5%
Vitamin E
0.02mg
0.58mg
4%
Calcium
23mg
49mg
3%
Copper
0.039mg
0.066mg
3%
Phosphorus
29mg
50mg
3%
Manganese
0.129mg
0.191mg
3%
Vitamin B1
0.046mg
0.01mg
3%
Vitamin B3
0.116mg
0.64mg
3%
Magnesium
10mg
17mg
2%
Sodium
4mg
52mg
2%
Vitamin B5
0.123mg
0.232mg
2%
Folate
19µg
27µg
2%
Fructose
1.29g
2%
Carbs
9.34g
7.3g
1%
Choline
6.1mg
13.2mg
1%
Polyunsaturated fat
0.017g
0.169g
1%
Calories
40kcal
31kcal
0%
Protein
1.1g
1.24g
0%
Protein per 100 calories
2.8g
4g
N/A
Calories per 10 g protein
364kcal
250kcal
N/A
Weight per 100 calories
250g
323g
N/A
Fats
0.1g
0.2g
0%
Net carbs
7.64g
4.2g
N/A
Sugar
4.24g
3.93g
N/A
Zinc
0.17mg
0.2mg
0%
Selenium
0.5µg
0.7µg
0%
Vitamin B2
0.027mg
0.032mg
0%
Saturated fat
0.042g
0.09g
0%
Monounsaturated fat
0.013g
0.068g
0%
Tryptophan
0.014mg
0%
Threonine
0.021mg
0%
Isoleucine
0.014mg
0%
Leucine
0.025mg
0%
Lysine
0.039mg
0%
Methionine
0.002mg
0%
Phenylalanine
0.025mg
0%
Valine
0.021mg
0%
Histidine
0.014mg
0%
Macronutrient Comparison
Macronutrient breakdown side-by-side comparison
1
9%
89%
Protein:
1.1 g
Fats:
0.1 g
Carbs:
9.34 g
Water:
89.11 g
Other:
0.35 g
4
7%
90%
Protein:
1.24 g
Fats:
0.2 g
Carbs:
7.3 g
Water:
90.21 g
Other:
1.05 g
Contains
more
Carbs Carbs
+27.9%
Contains
more
Protein Protein
+12.7%
Contains
more
Fats Fats
+100%
Contains
more
Other Other
+200%
Fat Type Comparison
Fat type breakdown side-by-side comparison
1
58%
18%
24%
Saturated fat:
Sat. Fat
0.042 g
Monounsaturated fat:
Mono. Fat
0.013 g
Polyunsaturated fat:
Poly. Fat
0.017 g
2
28%
21%
52%
Saturated fat:
Sat. Fat
0.09 g
Monounsaturated fat:
Mono. Fat
0.068 g
Polyunsaturated fat:
Poly. Fat
0.169 g
Contains
less
Sat. Fat Saturated fat
-53.3%
Contains
more
Mono. Fat Monounsaturated fat
+423.1%
Contains
more
Poly. Fat Polyunsaturated fat
+894.1%