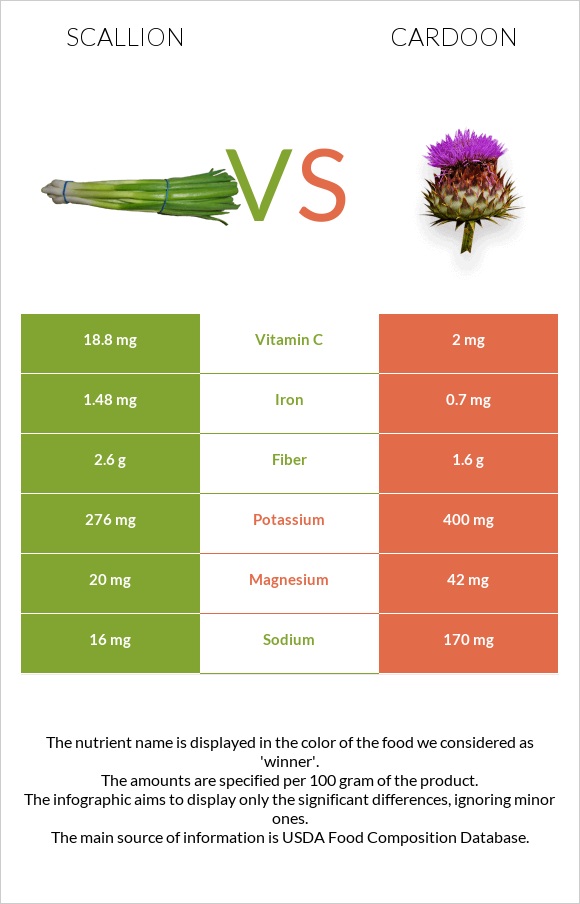
Summary of differences between scallions and cardoon Scallions have more vitamin A, vitamin C, and iron, while cardoon has more copper, vitamin B5, and magnesium. Scallions cover your daily need for vitamin A, 20% more than cardoon. Scallions contain 9 times more vitamin C than cardoon. While scallions contain 18.8mg of vitamin C, cardoon contains only 2mg. The amount of sodium in scallions is lower. These are the specific foods used in this comparison Onions, spring or scallions (includes tops and bulb), raw and Cardoon, raw .
Infographic
Mineral Comparison
Mineral comparison score is based on the number of minerals by which one or the other food is richer. The "coverage" charts below show how much of the daily needs can be covered by 300 grams of the food.
5
100 g
300 g
1 small (3" long) - 5g 1 tbsp chopped - 6g 1 medium (4-1/8" long) - 15g 1 large - 25g
Magnesium
Magnesium
Calcium
Calcium
Potassium
Potassium
Iron
Iron
Copper
Copper
Zinc
Zinc
Phosphorus
Phosphorus
Sodium
Sodium
Manganese
Manganese
Selenium
Selenium
14%
22%
24%
56%
28%
11%
16%
2.1%
21%
3.3%
4
100 g
300 g
1 cup, shredded - 178g
Magnesium
Magnesium
Calcium
Calcium
Potassium
Potassium
Iron
Iron
Copper
Copper
Zinc
Zinc
Phosphorus
Phosphorus
Sodium
Sodium
Manganese
Manganese
Selenium
Selenium
30%
21%
35%
26%
77%
4.6%
9.9%
22%
33%
1.1%
Vitamin Comparison
Vitamin comparison score is based on the number of vitamins by which one or the other food is richer. The "coverage" charts below show how much of the daily needs can be covered by 300 grams of the food.
7
100 g
300 g
1 small (3" long) - 5g 1 tbsp chopped - 6g 1 medium (4-1/8" long) - 15g 1 large - 25g
Vitamin C
Vit. C
Vitamin D
Vit. D
Vitamin A
Vit. A
Vitamin E
Vit. E
Vitamin B1
Vit. B1
Vitamin B2
Vit. B2
Vitamin B3
Vit. B3
Vitamin B5
Vit. B5
Vitamin B6
Vit. B6
Vitamin B12
Vit. B12
Vitamin K
Vit. K
Folate
Folate
63%
0%
17%
11%
14%
18%
9.8%
4.5%
14%
0%
518%
48%
2
100 g
300 g
1 cup, shredded - 178g
Vitamin C
Vit. C
Vitamin D
Vit. D
Vitamin A
Vit. A
Vitamin E
Vit. E
Vitamin B1
Vit. B1
Vitamin B2
Vit. B2
Vitamin B3
Vit. B3
Vitamin B5
Vit. B5
Vitamin B6
Vit. B6
Vitamin B12
Vit. B12
Vitamin K
Vit. K
Folate
Folate
6.7%
0%
0%
0%
5%
6.9%
5.6%
20%
27%
0%
0%
51%
All nutrients comparison - raw data values
Nutrient
DV% diff.
Vitamin K
207µg
173%
Vitamin C
18.8mg
2mg
19%
Copper
0.083mg
0.231mg
16%
Iron
1.48mg
0.7mg
10%
Sodium
16mg
170mg
7%
Vitamin A
50µg
0µg
6%
Magnesium
20mg
42mg
5%
Vitamin B5
0.075mg
0.338mg
5%
Potassium
276mg
400mg
4%
Fiber
2.6g
1.6g
4%
Vitamin E
0.55mg
4%
Manganese
0.16mg
0.256mg
4%
Vitamin B2
0.08mg
0.03mg
4%
Vitamin B6
0.061mg
0.116mg
4%
Vitamin B1
0.055mg
0.02mg
3%
Protein
1.83g
0.7g
2%
Zinc
0.39mg
0.17mg
2%
Phosphorus
37mg
23mg
2%
Calories
32kcal
17kcal
1%
Carbs
7.34g
4.07g
1%
Selenium
0.6µg
0.2µg
1%
Vitamin B3
0.525mg
0.3mg
1%
Folate
64µg
68µg
1%
Choline
5.7mg
1%
Protein per 100 calories
5.7g
4.1g
N/A
Calories per 10 g protein
175kcal
243kcal
N/A
Weight per 100 calories
313g
588g
N/A
Fats
0.19g
0.1g
0%
Net carbs
4.74g
2.47g
N/A
Calcium
72mg
70mg
0%
Sugar
2.33g
N/A
Saturated fat
0.032g
0.011g
0%
Monounsaturated fat
0.027g
0.018g
0%
Polyunsaturated fat
0.074g
0.041g
0%
Tryptophan
0.02mg
0%
Threonine
0.072mg
0%
Isoleucine
0.077mg
0%
Leucine
0.109mg
0%
Lysine
0.091mg
0%
Methionine
0.02mg
0%
Phenylalanine
0.059mg
0%
Valine
0.081mg
0%
Histidine
0.032mg
0%
Macronutrient Comparison
Macronutrient breakdown side-by-side comparison
3
2%
7%
90%
Protein:
1.83 g
Fats:
0.19 g
Carbs:
7.34 g
Water:
89.83 g
Other:
0.81 g
2
4%
94%
Protein:
0.7 g
Fats:
0.1 g
Carbs:
4.07 g
Water:
94 g
Other:
1.13 g
Contains
more
Protein Protein
+161.4%
Contains
more
Fats Fats
+90%
Contains
more
Carbs Carbs
+80.3%
Contains
more
Other Other
+39.5%
Fat Type Comparison
Fat type breakdown side-by-side comparison
2
24%
20%
56%
Saturated fat:
Sat. Fat
0.032 g
Monounsaturated fat:
Mono. Fat
0.027 g
Polyunsaturated fat:
Poly. Fat
0.074 g
1
16%
26%
59%
Saturated fat:
Sat. Fat
0.011 g
Monounsaturated fat:
Mono. Fat
0.018 g
Polyunsaturated fat:
Poly. Fat
0.041 g
Contains
more
Mono. Fat Monounsaturated fat
+50%
Contains
more
Poly. Fat Polyunsaturated fat
+80.5%
Contains
less
Sat. Fat Saturated fat
-65.6%