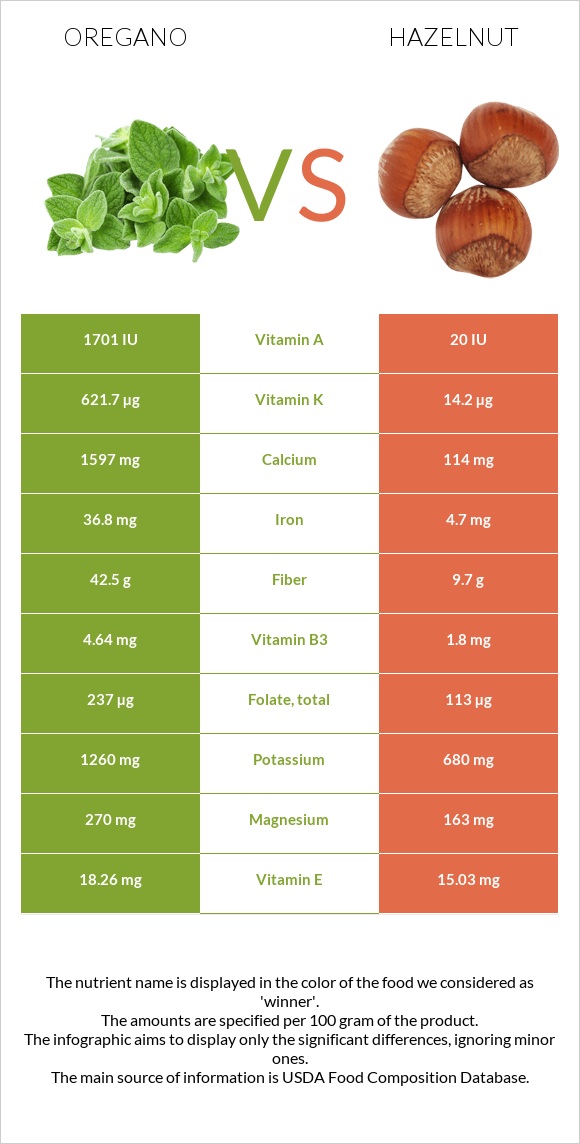
What are the differences between oregano and hazelnut? Oregano is higher in vitamin K, iron, calcium, fiber, vitamin B6, vitamin A, and vitamin B2, yet hazelnut is higher in copper, manganese, and vitamin B1. Oregano's daily need coverage for vitamin K is 506% more. Oregano has 85 times more vitamin A than hazelnut. While oregano has 1701 IU of vitamin A, hazelnut has only 20 IU. We used Spices, oregano, dried and Nuts, hazelnuts or filberts types in this article.
Infographic
Mineral Comparison
Mineral comparison score is based on the number of minerals by which one or the other food is richer. The "coverage" charts below show how much of the daily needs can be covered by 300 grams of the food.
5
100 g
300 g
0.25 tsp - 0.5g 1 tsp, ground - 1.8g
Magnesium
Magnesium
Calcium
Calcium
Potassium
Potassium
Iron
Iron
Copper
Copper
Zinc
Zinc
Phosphorus
Phosphorus
Sodium
Sodium
Manganese
Manganese
Selenium
Selenium
193%
479%
111%
1380%
211%
73%
63%
3.3%
651%
25%
4
100 g
300 g
10 nuts - 14g 1 oz (21 whole kernels) - 28.35g 1 cup, ground - 75g 1 cup, chopped - 115g 1 cup, whole - 135g
Magnesium
Magnesium
Calcium
Calcium
Potassium
Potassium
Iron
Iron
Copper
Copper
Zinc
Zinc
Phosphorus
Phosphorus
Sodium
Sodium
Manganese
Manganese
Selenium
Selenium
116%
34%
60%
176%
575%
67%
124%
0%
805%
13%
Vitamin Comparison
Vitamin comparison score is based on the number of vitamins by which one or the other food is richer. The "coverage" charts below show how much of the daily needs can be covered by 300 grams of the food.
7
100 g
300 g
0.25 tsp - 0.5g 1 tsp, ground - 1.8g
Vitamin C
Vit. C
Vitamin D
Vit. D
Vitamin A
Vit. A
Vitamin E
Vit. E
Vitamin B1
Vit. B1
Vitamin B2
Vit. B2
Vitamin B3
Vit. B3
Vitamin B5
Vit. B5
Vitamin B6
Vit. B6
Vitamin B12
Vit. B12
Vitamin K
Vit. K
Folate
Folate
7.7%
0%
28%
365%
44%
122%
87%
55%
241%
0%
1554%
178%
2
100 g
300 g
10 nuts - 14g 1 oz (21 whole kernels) - 28.35g 1 cup, ground - 75g 1 cup, chopped - 115g 1 cup, whole - 135g
Vitamin C
Vit. C
Vitamin D
Vit. D
Vitamin A
Vit. A
Vitamin E
Vit. E
Vitamin B1
Vit. B1
Vitamin B2
Vit. B2
Vitamin B3
Vit. B3
Vitamin B5
Vit. B5
Vitamin B6
Vit. B6
Vitamin B12
Vit. B12
Vitamin K
Vit. K
Folate
Folate
21%
0%
0.33%
301%
161%
26%
34%
55%
130%
0%
36%
85%
All nutrients comparison - raw data values
Nutrient
DV% diff.
Vitamin K
621.7µg
14.2µg
506%
Iron
36.8mg
4.7mg
401%
Calcium
1597mg
114mg
148%
Fiber
42.5g
9.7g
131%
Copper
0.633mg
1.725mg
121%
Monounsaturated fat
0.716g
45.652g
112%
Fats
4.28g
60.75g
87%
Manganese
4.99mg
6.175mg
52%
Polyunsaturated fat
1.369g
7.92g
44%
Vitamin B1
0.177mg
0.643mg
39%
Vitamin B6
1.044mg
0.563mg
37%
Vitamin B2
0.528mg
0.113mg
32%
Folate
237µg
113µg
31%
Magnesium
270mg
163mg
25%
Vitamin E
18.26mg
15.03mg
22%
Phosphorus
148mg
290mg
20%
Calories
265kcal
628kcal
18%
Vitamin B3
4.64mg
1.8mg
18%
Carbs
68.92g
16.7g
17%
Potassium
1260mg
680mg
17%
Saturated fat
1.551g
4.464g
13%
Protein
9g
14.95g
12%
Vitamin A
85µg
1µg
9%
Vitamin C
2.3mg
6.3mg
4%
Selenium
4.5µg
2.4µg
4%
Zinc
2.69mg
2.45mg
2%
Choline
32.3mg
45.6mg
2%
Sodium
25mg
0mg
1%
Fructose
1.13g
0.07g
1%
Protein per 100 calories
3.4g
2.4g
N/A
Calories per 10 g protein
294kcal
420kcal
N/A
Weight per 100 calories
38g
16g
N/A
Unsaturated / Saturated Fat ratio
1.3
12
N/A
Net carbs
26.42g
7g
N/A
Sugar
4.09g
4.34g
N/A
Starch
0.48g
0%
Vitamin B5
0.921mg
0.918mg
0%
Tryptophan
0.203mg
0.193mg
0%
Threonine
0.322mg
0.497mg
0%
Isoleucine
0.441mg
0.545mg
0%
Leucine
0.78mg
1.063mg
0%
Lysine
0.5mg
0.42mg
0%
Methionine
0.127mg
0.221mg
0%
Phenylalanine
0.449mg
0.663mg
0%
Valine
0.585mg
0.701mg
0%
Histidine
0.144mg
0.432mg
0%
Omega-3 - ALA
0.621g
N/A
Macronutrient Comparison
Macronutrient breakdown side-by-side comparison
3
9%
4%
69%
10%
8%
Protein:
9 g
Fats:
4.28 g
Carbs:
68.92 g
Water:
9.93 g
Other:
7.87 g
2
15%
61%
17%
5%
2%
Protein:
14.95 g
Fats:
60.75 g
Carbs:
16.7 g
Water:
5.31 g
Other:
2.29 g
Contains
more
Carbs Carbs
+312.7%
Contains
more
Water Water
+87%
Contains
more
Other Other
+243.7%
Contains
more
Protein Protein
+66.1%
Contains
more
Fats Fats
+1319.4%
Fat Type Comparison
Fat type breakdown side-by-side comparison
1
43%
20%
38%
Saturated fat:
Sat. Fat
1.551 g
Monounsaturated fat:
Mono. Fat
0.716 g
Polyunsaturated fat:
Poly. Fat
1.369 g
2
8%
79%
14%
Saturated fat:
Sat. Fat
4.464 g
Monounsaturated fat:
Mono. Fat
45.652 g
Polyunsaturated fat:
Poly. Fat
7.92 g
Contains
less
Sat. Fat Saturated fat
-65.3%
Contains
more
Mono. Fat Monounsaturated fat
+6276%
Contains
more
Poly. Fat Polyunsaturated fat
+478.5%
Carbohydrate type comparison
Carbohydrate type breakdown side-by-side comparison
3
22%
46%
28%
4%
Starch:
0 g
Sucrose:
0.91 g
Glucose:
1.9 g
Fructose:
1.13 g
Lactose:
0 g
Maltose:
0 g
Galactose:
0.15 g
2
10%
87%
Starch:
0.48 g
Sucrose:
4.2 g
Glucose:
0.07 g
Fructose:
0.07 g
Lactose:
0 g
Maltose:
0 g
Galactose:
0 g
Contains
more
Glucose Glucose
+2614.3%
Contains
more
Fructose Fructose
+1514.3%
Contains
more
Galactose Galactose
+∞%
Contains
more
Starch Starch
+∞%
Contains
more
Sucrose Sucrose
+361.5%
~equal in
Lactose
~0g
~equal in
Maltose
~0g