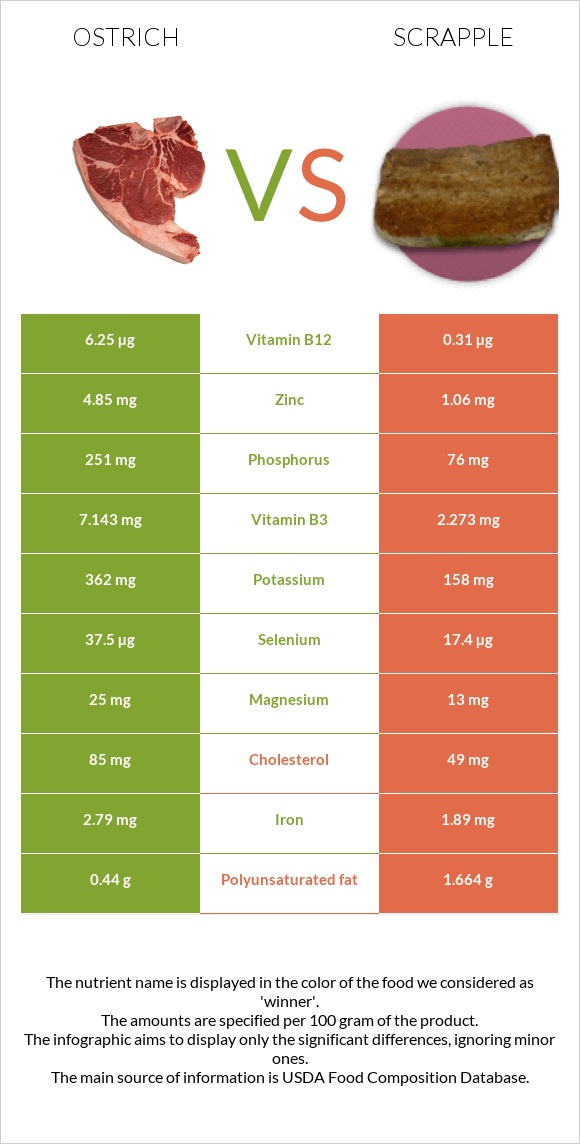
What are the differences between ostrich and scrapple? Ostrich is higher in vitamin B12, selenium, zinc, vitamin B6, vitamin B3, and phosphorus, yet scrapple is higher in vitamin A. Ostrich's daily need coverage for vitamin B12 is 248% more. Ostrich has 5 times more zinc than scrapple. While ostrich has 4.85mg of zinc, scrapple has only 1.06mg. The amount of cholesterol in scrapple is lower. We used Ostrich, tip trimmed, cooked and Scrapple, pork types in this article.
Infographic
Mineral Comparison
Mineral comparison score is based on the number of minerals by which one or the other food is richer. The "coverage" charts below show how much of the daily needs can be covered by 300 grams of the food.
8
100 g
300 g
1 serving ( 3 oz ) - 85g
Magnesium
Magnesium
Calcium
Calcium
Potassium
Potassium
Iron
Iron
Copper
Copper
Zinc
Zinc
Phosphorus
Phosphorus
Sodium
Sodium
Manganese
Manganese
Selenium
Selenium
18%
1.8%
32%
105%
51%
132%
108%
10%
2.5%
205%
2
100 g
300 g
1 cubic inch - 17g 1 oz cooked - 25g 2 oz - 56g
Magnesium
Magnesium
Calcium
Calcium
Potassium
Potassium
Iron
Iron
Copper
Copper
Zinc
Zinc
Phosphorus
Phosphorus
Sodium
Sodium
Manganese
Manganese
Selenium
Selenium
9.3%
2.1%
14%
71%
71%
29%
33%
63%
0%
95%
Vitamin Comparison
Vitamin comparison score is based on the number of vitamins by which one or the other food is richer. The "coverage" charts below show how much of the daily needs can be covered by 300 grams of the food.
7
100 g
300 g
1 serving ( 3 oz ) - 85g
Vitamin C
Vit. C
Vitamin D
Vit. D
Vitamin A
Vit. A
Vitamin E
Vit. E
Vitamin B1
Vit. B1
Vitamin B2
Vit. B2
Vitamin B3
Vit. B3
Vitamin B5
Vit. B5
Vitamin B6
Vit. B6
Vitamin B12
Vit. B12
Vitamin K
Vit. K
Folate
Folate
0%
0%
0%
4.6%
58%
67%
134%
79%
126%
781%
0%
11%
4
100 g
300 g
1 cubic inch - 17g 1 oz cooked - 25g 2 oz - 56g
Vitamin C
Vit. C
Vitamin D
Vit. D
Vitamin A
Vit. A
Vitamin E
Vit. E
Vitamin B1
Vit. B1
Vitamin B2
Vit. B2
Vitamin B3
Vit. B3
Vitamin B5
Vit. B5
Vitamin B6
Vit. B6
Vitamin B12
Vit. B12
Vitamin K
Vit. K
Folate
Folate
8.3%
4.5%
209%
3%
29%
66%
43%
0%
28%
39%
8.5%
3.8%
All nutrients comparison - raw data values
Nutrient
DV% diff.
Vitamin B12
6.25µg
0.31µg
248%
Vitamin A
0µg
626µg
70%
Protein
28.49g
8.06g
41%
Selenium
37.5µg
17.4µg
37%
Zinc
4.85mg
1.06mg
34%
Vitamin B6
0.545mg
0.12mg
33%
Vitamin B3
7.143mg
2.273mg
30%
Vitamin B5
1.318mg
26%
Phosphorus
251mg
76mg
25%
Fats
2.57g
13.87g
17%
Sodium
80mg
482mg
17%
Saturated fat
1g
4.732g
17%
Choline
72.4mg
13%
Monounsaturated fat
0.97g
6.156g
13%
Cholesterol
85mg
49mg
12%
Iron
2.79mg
1.89mg
11%
Vitamin B1
0.232mg
0.116mg
10%
Polyunsaturated fat
0.44g
1.664g
8%
Copper
0.152mg
0.212mg
7%
Potassium
362mg
158mg
6%
Carbs
0g
14.06g
5%
Calories
145kcal
213kcal
3%
Vitamin C
0mg
2.5mg
3%
Magnesium
25mg
13mg
3%
Vitamin K
3.4µg
3%
Folate
15µg
5µg
3%
Vitamin D*
13 IU
2%
Vitamin D
0.3µg
2%
Fiber
0g
0.3g
1%
Vitamin E
0.23mg
0.15mg
1%
Manganese
0.019mg
1%
Protein per 100 calories
20g
3.8g
N/A
Calories per 10 g protein
51kcal
264kcal
N/A
Weight per 100 calories
69g
47g
N/A
Unsaturated / Saturated Fat ratio
1.4
1.7
N/A
Net carbs
0g
13.76g
N/A
Calcium
6mg
7mg
0%
Sugar
0g
0.2g
N/A
Vitamin B2
0.292mg
0.287mg
0%
Tryptophan
0.254mg
0%
Threonine
1.25mg
0%
Isoleucine
1.354mg
0%
Leucine
2.315mg
0%
Lysine
2.516mg
0%
Methionine
0.796mg
0%
Phenylalanine
1.176mg
0%
Valine
1.407mg
0%
Histidine
0.716mg
0%
Macronutrient Comparison
Macronutrient breakdown side-by-side comparison
2
28%
3%
69%
Protein:
28.49 g
Fats:
2.57 g
Carbs:
0 g
Water:
68.51 g
Other:
0.43 g
3
8%
14%
14%
62%
Protein:
8.06 g
Fats:
13.87 g
Carbs:
14.06 g
Water:
62.47 g
Other:
1.54 g
Contains
more
Protein Protein
+253.5%
Contains
more
Fats Fats
+439.7%
Contains
more
Carbs Carbs
+∞%
Contains
more
Other Other
+258.1%
Fat Type Comparison
Fat type breakdown side-by-side comparison
1
41%
40%
18%
Saturated fat:
Sat. Fat
1 g
Monounsaturated fat:
Mono. Fat
0.97 g
Polyunsaturated fat:
Poly. Fat
0.44 g
2
38%
49%
13%
Saturated fat:
Sat. Fat
4.732 g
Monounsaturated fat:
Mono. Fat
6.156 g
Polyunsaturated fat:
Poly. Fat
1.664 g
Contains
less
Sat. Fat Saturated fat
-78.9%
Contains
more
Mono. Fat Monounsaturated fat
+534.6%
Contains
more
Poly. Fat Polyunsaturated fat
+278.2%