Pancake vs. Submarine sandwich — In-Depth Nutrition Comparison
Compare
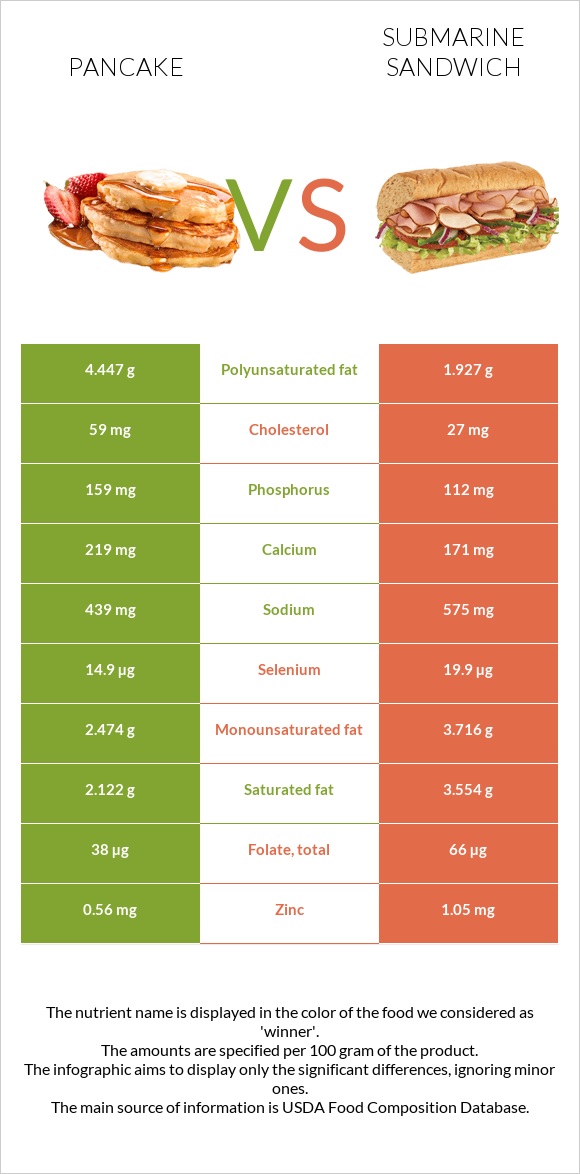
What are the differences between pancake and submarine sandwich?
- Pancake is higher in phosphorus, yet submarine sandwich is higher in vitamin B3, vitamin B6, vitamin B1, selenium, vitamin C, folate, and manganese.
- Submarine sandwich's daily need coverage for vitamin B3 is 17% more.
- Pancake has 2 times more cholesterol than submarine sandwich. While pancake has 59mg of cholesterol, submarine sandwich has only 27mg.
We used Pancakes, plain, prepared from recipe and Fast foods, submarine sandwich, cold cut on white bread with lettuce and tomato types in this article.
Infographic
Infographic link
Mineral Comparison
Mineral comparison score is based on the number of minerals by which one or the other food is richer. The "coverage" charts below show how much of the daily needs can be covered by 300 grams of the food.
| Contains more CalciumCalcium | +28.1% |
| Contains more PhosphorusPhosphorus | +42% |
| Contains less SodiumSodium | -23.7% |
| Contains more MagnesiumMagnesium | +25% |
| Contains more PotassiumPotassium | +113.6% |
| Contains more CopperCopper | +71.4% |
| Contains more ZincZinc | +87.5% |
| Contains more ManganeseManganese | +77% |
| Contains more SeleniumSelenium | +33.6% |
Vitamin Comparison
Vitamin comparison score is based on the number of vitamins by which one or the other food is richer. The "coverage" charts below show how much of the daily needs can be covered by 300 grams of the food.
| Contains more Vitamin AVitamin A | +145.5% |
| Contains more Vitamin CVitamin C | +2400% |
| Contains more Vitamin B1Vitamin B1 | +70.6% |
| Contains more Vitamin B3Vitamin B3 | +175.9% |
| Contains more Vitamin B5Vitamin B5 | +37% |
| Contains more Vitamin B6Vitamin B6 | +341.3% |
| Contains more FolateFolate | +73.7% |
All nutrients comparison - raw data values
| Nutrient |  |
 |
DV% diff. |
| Vitamin B3 | 1.567mg | 4.323mg | 17% |
| Polyunsaturated fat | 4.447g | 1.927g | 17% |
| Vitamin B1 | 0.201mg | 0.343mg | 12% |
| Vitamin B6 | 0.046mg | 0.203mg | 12% |
| Cholesterol | 59mg | 27mg | 11% |
| Selenium | 14.9µg | 19.9µg | 9% |
| Protein | 6.4g | 10.52g | 8% |
| Vitamin C | 0.3mg | 7.5mg | 8% |
| Phosphorus | 159mg | 112mg | 7% |
| Manganese | 0.2mg | 0.354mg | 7% |
| Folate | 38µg | 66µg | 7% |
| Saturated fat | 2.122g | 3.554g | 7% |
| Starch | 15.67g | 6% | |
| Sodium | 439mg | 575mg | 6% |
| Calcium | 219mg | 171mg | 5% |
| Fiber | 1.2g | 5% | |
| Choline | 29.1mg | 5% | |
| Potassium | 132mg | 282mg | 4% |
| Copper | 0.049mg | 0.084mg | 4% |
| Zinc | 0.56mg | 1.05mg | 4% |
| Vitamin A | 54µg | 22µg | 4% |
| Vitamin K | 4.5µg | 4% | |
| Carbs | 28.3g | 20.43g | 3% |
| Vitamin E | 0.41mg | 3% | |
| Vitamin B5 | 0.405mg | 0.555mg | 3% |
| Monounsaturated fat | 2.474g | 3.716g | 3% |
| Fructose | 1.4g | 2% | |
| Calories | 227kcal | 213kcal | 1% |
| Fats | 9.7g | 10.04g | 1% |
| Vitamin D | 7 IU | 1% | |
| Magnesium | 16mg | 20mg | 1% |
| Vitamin D | 0.2µg | 1% | |
| Vitamin B2 | 0.281mg | 0.267mg | 1% |
| Net carbs | 28.3g | 19.23g | N/A |
| Iron | 1.8mg | 1.81mg | 0% |
| Sugar | 3.18g | N/A | |
| Vitamin B12 | 0.22µg | 0.22µg | 0% |
| Trans fat | 0.119g | N/A | |
| Tryptophan | 0.08mg | 0.1mg | 0% |
| Threonine | 0.237mg | 0.331mg | 0% |
| Isoleucine | 0.297mg | 0.431mg | 0% |
| Leucine | 0.513mg | 0.752mg | 0% |
| Lysine | 0.321mg | 0.491mg | 0% |
| Methionine | 0.147mg | 0.21mg | 0% |
| Phenylalanine | 0.319mg | 0.431mg | 0% |
| Valine | 0.335mg | 0.501mg | 0% |
| Histidine | 0.152mg | 0.301mg | 0% |
| Omega-3 - EPA | 0g | 0.001g | N/A |
| Omega-3 - DHA | 0.005g | 0.002g | N/A |
| Omega-3 - ALA | 0.104g | N/A | |
| Omega-3 - DPA | 0g | 0.005g | N/A |
| Omega-3 - Eicosatrienoic acid | 0.004g | N/A | |
| Omega-6 - Gamma-linoleic acid | 0.003g | N/A | |
| Omega-6 - Dihomo-gamma-linoleic acid | 0.013g | N/A | |
| Omega-6 - Eicosadienoic acid | 0.048g | N/A | |
| Omega-6 - Linoleic acid | 1.665g | N/A |
Macronutrient Comparison
Macronutrient breakdown side-by-side comparison
Protein:
6.4 g
Fats:
9.7 g
Carbs:
28.3 g
Water:
52.9 g
Other:
2.7 g
Protein:
10.52 g
Fats:
10.04 g
Carbs:
20.43 g
Water:
56.51 g
Other:
2.5 g
| Contains more CarbsCarbs | +38.5% |
| Contains more ProteinProtein | +64.4% |
~equal in
Fats
~10.04g
~equal in
Water
~56.51g
~equal in
Other
~2.5g
Fat Type Comparison
Fat type breakdown side-by-side comparison
Saturated fat:
Sat. Fat
2.122 g
Monounsaturated fat:
Mono. Fat
2.474 g
Polyunsaturated fat:
Poly. Fat
4.447 g
Saturated fat:
Sat. Fat
3.554 g
Monounsaturated fat:
Mono. Fat
3.716 g
Polyunsaturated fat:
Poly. Fat
1.927 g
| Contains less Sat. FatSaturated fat | -40.3% |
| Contains more Poly. FatPolyunsaturated fat | +130.8% |
| Contains more Mono. FatMonounsaturated fat | +50.2% |


