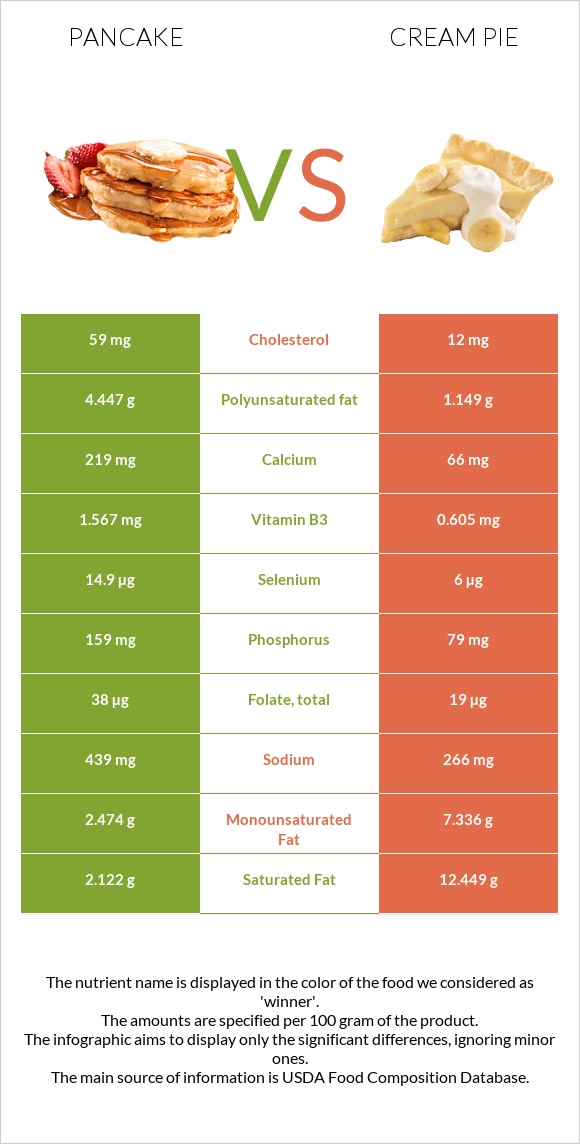
Summary of differences between pancake and cream pie Pancake has more selenium, calcium, phosphorus, vitamin B2, vitamin B1, and vitamin B3, while cream pie has more copper. Cream pie covers your daily need for saturated fat, 52% more than pancake. Pancake contains 5 times more cholesterol than cream pie. While pancake contains 59mg of cholesterol, cream pie contains only 12mg. These are the specific foods used in this comparison Pancakes, plain, prepared from recipe and Pie, chocolate creme, commercially prepared .
Infographic
Mineral Comparison
Mineral comparison score is based on the number of minerals by which one or the other food is richer. The "coverage" charts below show how much of the daily needs can be covered by 300 grams of the food.
6
100 g
300 g
1 oz - 28.35g 1 pancake (4" dia) - 38g 1 pancake (6" dia) - 77g
Magnesium
Magnesium
Calcium
Calcium
Potassium
Potassium
Iron
Iron
Copper
Copper
Zinc
Zinc
Phosphorus
Phosphorus
Sodium
Sodium
Manganese
Manganese
Selenium
Selenium
11%
66%
12%
68%
16%
15%
68%
57%
26%
81%
4
100 g
300 g
1 oz - 28.35g 1 piece (1/4 of 6" pie) - 99g 1 piece (1/6 of 8" pie) - 113g 1 serving .167 pie - 120g
Magnesium
Magnesium
Calcium
Calcium
Potassium
Potassium
Iron
Iron
Copper
Copper
Zinc
Zinc
Phosphorus
Phosphorus
Sodium
Sodium
Manganese
Manganese
Selenium
Selenium
14%
20%
14%
56%
39%
12%
34%
35%
21%
33%
Vitamin Comparison
Vitamin comparison score is based on the number of vitamins by which one or the other food is richer. The "coverage" charts below show how much of the daily needs can be covered by 300 grams of the food.
9
100 g
300 g
1 oz - 28.35g 1 pancake (4" dia) - 38g 1 pancake (6" dia) - 77g
Vitamin C
Vit. C
Vitamin D
Vit. D
Vitamin A
Vit. A
Vitamin E
Vit. E
Vitamin B1
Vit. B1
Vitamin B2
Vit. B2
Vitamin B3
Vit. B3
Vitamin B5
Vit. B5
Vitamin B6
Vit. B6
Vitamin B12
Vit. B12
Vitamin K
Vit. K
Folate
Folate
1%
0%
18%
0%
50%
65%
29%
24%
11%
28%
0%
29%
3
100 g
300 g
1 oz - 28.35g 1 piece (1/4 of 6" pie) - 99g 1 piece (1/6 of 8" pie) - 113g 1 serving .167 pie - 120g
Vitamin C
Vit. C
Vitamin D
Vit. D
Vitamin A
Vit. A
Vitamin E
Vit. E
Vitamin B1
Vit. B1
Vitamin B2
Vit. B2
Vitamin B3
Vit. B3
Vitamin B5
Vit. B5
Vitamin B6
Vit. B6
Vitamin B12
Vit. B12
Vitamin K
Vit. K
Folate
Folate
0%
1.5%
15%
22%
22%
32%
11%
14%
4.6%
15%
24%
14%
All nutrients comparison - raw data values
Nutrient
DV% diff.
Saturated fat
2.122g
12.449g
47%
Polyunsaturated fat
4.447g
1.149g
22%
Fats
9.7g
22.41g
20%
Cholesterol
59mg
12mg
16%
Selenium
14.9µg
6µg
16%
Calcium
219mg
66mg
15%
Monounsaturated fat
2.474g
7.336g
12%
Phosphorus
159mg
79mg
11%
Vitamin B2
0.281mg
0.14mg
11%
Vitamin B1
0.201mg
0.087mg
10%
Copper
0.049mg
0.118mg
8%
Sodium
439mg
266mg
8%
Vitamin K
9.5µg
8%
Vitamin E
1.09mg
7%
Calories
227kcal
353kcal
6%
Vitamin B3
1.567mg
0.605mg
6%
Protein
6.4g
4.15g
5%
Folate
38µg
19µg
5%
Iron
1.8mg
1.49mg
4%
Vitamin B12
0.22µg
0.12µg
4%
Carbs
28.3g
38.44g
3%
Fiber
0.8g
3%
Vitamin B5
0.405mg
0.232mg
3%
Choline
17.9mg
3%
Manganese
0.2mg
0.161mg
2%
Vitamin B6
0.046mg
0.02mg
2%
Vitamin D
0.1µg
1%
Magnesium
16mg
19mg
1%
Potassium
132mg
161mg
1%
Zinc
0.56mg
0.44mg
1%
Vitamin A
54µg
46µg
1%
Protein per 100 calories
2.8g
1.2g
N/A
Calories per 10 g protein
355kcal
851kcal
N/A
Weight per 100 calories
44g
28g
N/A
Unsaturated / Saturated Fat ratio
3.3
0.68
N/A
Vitamin C
0.3mg
0mg
0%
Net carbs
28.3g
37.64g
N/A
Vitamin D*
3 IU
0%
Sugar
27.39g
N/A
Trans fat
2.49g
N/A
Tryptophan
0.08mg
0%
Threonine
0.237mg
0%
Isoleucine
0.297mg
0%
Leucine
0.513mg
0%
Lysine
0.321mg
0%
Methionine
0.147mg
0%
Phenylalanine
0.319mg
0%
Valine
0.335mg
0%
Histidine
0.152mg
0%
Omega-3 - EPA
0g
0.001g
N/A
Omega-3 - DHA
0.005g
0g
N/A
Macronutrient Comparison
Macronutrient breakdown side-by-side comparison
3
6%
10%
28%
53%
3%
Protein:
6.4 g
Fats:
9.7 g
Carbs:
28.3 g
Water:
52.9 g
Other:
2.7 g
2
4%
22%
38%
34%
Protein:
4.15 g
Fats:
22.41 g
Carbs:
38.44 g
Water:
33.92 g
Other:
1.08 g
Contains
more
Protein Protein
+54.2%
Contains
more
Water Water
+56%
Contains
more
Other Other
+150%
Contains
more
Fats Fats
+131%
Contains
more
Carbs Carbs
+35.8%
Fat Type Comparison
Fat type breakdown side-by-side comparison
2
23%
27%
49%
Saturated fat:
Sat. Fat
2.122 g
Monounsaturated fat:
Mono. Fat
2.474 g
Polyunsaturated fat:
Poly. Fat
4.447 g
1
59%
35%
5%
Saturated fat:
Sat. Fat
12.449 g
Monounsaturated fat:
Mono. Fat
7.336 g
Polyunsaturated fat:
Poly. Fat
1.149 g
Contains
less
Sat. Fat Saturated fat
-83%
Contains
more
Poly. Fat Polyunsaturated fat
+287%
Contains
more
Mono. Fat Monounsaturated fat
+196.5%