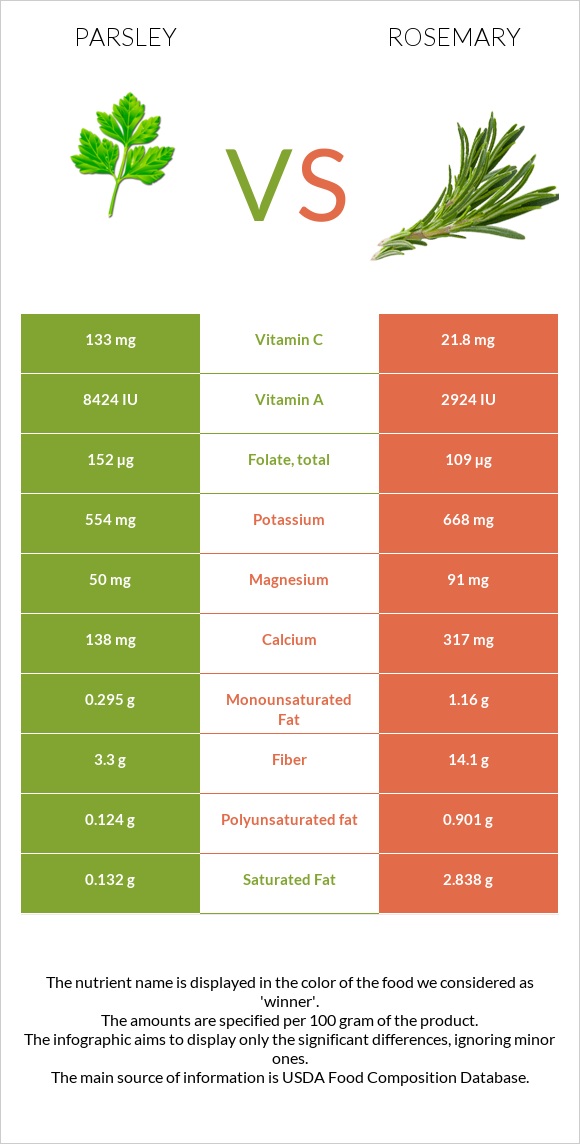
Significant differences between parsley and rosemary Parsley has more vitamin C, vitamin A, and folate; however, rosemary is richer in fiber, manganese, vitamin B6, calcium, copper, and magnesium. Parsley covers your daily vitamin C needs 124% more than rosemary. Rosemary has 3 times less vitamin A than parsley. Parsley has 8424 IU of vitamin A, while rosemary has 2924 IU. Parsley contains less saturated fat. Rosemary has a higher glycemic index. The glycemic index of rosemary is 70, while the glycemic index of parsley is 32. Specific food types used in this comparison are Parsley, fresh and Rosemary, fresh .
Infographic
Mineral Comparison
Mineral comparison score is based on the number of minerals by which one or the other food is richer. The "coverage" charts below show how much of the daily needs can be covered by 300 grams of the food.
2
100 g
300 g
1 tbsp - 3.8g 10 sprigs - 10g 1 cup chopped - 60g
Magnesium
Magnesium
Calcium
Calcium
Potassium
Potassium
Iron
Iron
Copper
Copper
Zinc
Zinc
Phosphorus
Phosphorus
Sodium
Sodium
Manganese
Manganese
Selenium
Selenium
36%
41%
49%
233%
50%
29%
25%
7.3%
21%
0.55%
7
100 g
300 g
1 tsp - 0.7g 1 tbsp - 1.7g
Magnesium
Magnesium
Calcium
Calcium
Potassium
Potassium
Iron
Iron
Copper
Copper
Zinc
Zinc
Phosphorus
Phosphorus
Sodium
Sodium
Manganese
Manganese
Selenium
Selenium
65%
95%
59%
249%
100%
25%
28%
3.4%
125%
0%
Vitamin Comparison
Vitamin comparison score is based on the number of vitamins by which one or the other food is richer. The "coverage" charts below show how much of the daily needs can be covered by 300 grams of the food.
7
100 g
300 g
1 tbsp - 3.8g 10 sprigs - 10g 1 cup chopped - 60g
Vitamin C
Vit. C
Vitamin D
Vit. D
Vitamin A
Vit. A
Vitamin E
Vit. E
Vitamin B1
Vit. B1
Vitamin B2
Vit. B2
Vitamin B3
Vit. B3
Vitamin B5
Vit. B5
Vitamin B6
Vit. B6
Vitamin B12
Vit. B12
Vitamin K
Vit. K
Folate
Folate
443%
0%
140%
15%
22%
23%
25%
24%
21%
0%
4100%
114%
3
100 g
300 g
1 tsp - 0.7g 1 tbsp - 1.7g
Vitamin C
Vit. C
Vitamin D
Vit. D
Vitamin A
Vit. A
Vitamin E
Vit. E
Vitamin B1
Vit. B1
Vitamin B2
Vit. B2
Vitamin B3
Vit. B3
Vitamin B5
Vit. B5
Vitamin B6
Vit. B6
Vitamin B12
Vit. B12
Vitamin K
Vit. K
Folate
Folate
73%
0%
49%
0%
9%
35%
17%
48%
78%
0%
0%
82%
All nutrients comparison - raw data values
Nutrient
DV% diff.
Vitamin K
1640µg
1367%
Vitamin C
133mg
21.8mg
124%
Fiber
3.3g
14.1g
43%
Manganese
0.16mg
0.96mg
35%
Vitamin A
421µg
146µg
31%
Vitamin B6
0.09mg
0.336mg
19%
Calcium
138mg
317mg
18%
Copper
0.149mg
0.301mg
17%
Saturated fat
0.132g
2.838g
12%
Folate
152µg
109µg
11%
Magnesium
50mg
91mg
10%
Fats
0.79g
5.86g
8%
Vitamin B5
0.4mg
0.804mg
8%
Iron
6.2mg
6.65mg
6%
Calories
36kcal
131kcal
5%
Carbs
6.33g
20.7g
5%
Vitamin E
0.75mg
5%
Polyunsaturated fat
0.124g
0.901g
5%
Vitamin B1
0.086mg
0.036mg
4%
Vitamin B2
0.098mg
0.152mg
4%
Potassium
554mg
668mg
3%
Vitamin B3
1.313mg
0.912mg
3%
Choline
12.8mg
2%
Monounsaturated fat
0.295g
1.16g
2%
Protein
2.97g
3.31g
1%
Zinc
1.07mg
0.93mg
1%
Phosphorus
58mg
66mg
1%
Sodium
56mg
26mg
1%
Protein per 100 calories
8.3g
2.5g
N/A
Calories per 10 g protein
121kcal
396kcal
N/A
Weight per 100 calories
278g
76g
N/A
Unsaturated / Saturated Fat ratio
3.2
0.73
N/A
Net carbs
3.03g
6.6g
N/A
Sugar
0.85g
N/A
Selenium
0.1µg
0%
Tryptophan
0.045mg
0.051mg
0%
Threonine
0.122mg
0.136mg
0%
Isoleucine
0.118mg
0.136mg
0%
Leucine
0.204mg
0.249mg
0%
Lysine
0.181mg
0.143mg
0%
Methionine
0.042mg
0.047mg
0%
Phenylalanine
0.145mg
0.169mg
0%
Valine
0.172mg
0.165mg
0%
Histidine
0.061mg
0.066mg
0%
Macronutrient Comparison
Macronutrient breakdown side-by-side comparison
1
3%
6%
88%
2%
Protein:
2.97 g
Fats:
0.79 g
Carbs:
6.33 g
Water:
87.71 g
Other:
2.2 g
4
3%
6%
21%
68%
2%
Protein:
3.31 g
Fats:
5.86 g
Carbs:
20.7 g
Water:
67.77 g
Other:
2.36 g
Contains
more
Water Water
+29.4%
Contains
more
Protein Protein
+11.4%
Contains
more
Fats Fats
+641.8%
Contains
more
Carbs Carbs
+227%
Fat Type Comparison
Fat type breakdown side-by-side comparison
1
24%
54%
23%
Saturated fat:
Sat. Fat
0.132 g
Monounsaturated fat:
Mono. Fat
0.295 g
Polyunsaturated fat:
Poly. Fat
0.124 g
2
58%
24%
18%
Saturated fat:
Sat. Fat
2.838 g
Monounsaturated fat:
Mono. Fat
1.16 g
Polyunsaturated fat:
Poly. Fat
0.901 g
Contains
less
Sat. Fat Saturated fat
-95.3%
Contains
more
Mono. Fat Monounsaturated fat
+293.2%
Contains
more
Poly. Fat Polyunsaturated fat
+626.6%