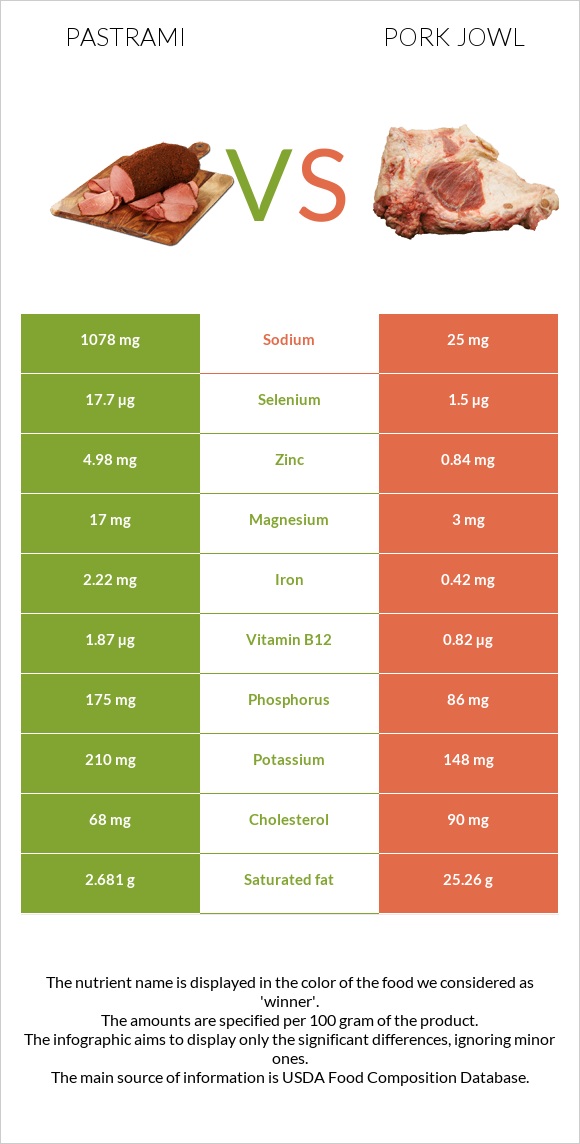
Significant differences between pastrami and pork jowl Pastrami has more vitamin B12, zinc, selenium, iron, phosphorus, and vitamin B6; however, pork jowl is richer in vitamin B1. Pork jowl covers your daily saturated fat needs 113% more than pastrami. Pork jowl has 43 times less sodium than pastrami. Pastrami has 1078mg of sodium, while pork jowl has 25mg. Pastrami has a higher glycemic index. The glycemic index of pastrami is 70, while the glycemic index of pork jowl is 0. Specific food types used in this comparison are Beef, cured, pastrami and Pork, fresh, variety meats, and by-products, jowl, raw .
Infographic
Mineral Comparison
Mineral comparison score is based on the number of minerals by which one or the other food is richer. The "coverage" charts below show how much of the daily needs can be covered by 300 grams of the food.
9
100 g
300 g
1 slice (1 oz) - 28g 1 package, 2.5 oz - 71g
Magnesium
Magnesium
Calcium
Calcium
Potassium
Potassium
Iron
Iron
Copper
Copper
Zinc
Zinc
Phosphorus
Phosphorus
Sodium
Sodium
Manganese
Manganese
Selenium
Selenium
12%
3%
19%
83%
30%
136%
75%
141%
3.5%
97%
1
100 g
300 g
1 oz - 28.35g 4 oz - 113g
Magnesium
Magnesium
Calcium
Calcium
Potassium
Potassium
Iron
Iron
Copper
Copper
Zinc
Zinc
Phosphorus
Phosphorus
Sodium
Sodium
Manganese
Manganese
Selenium
Selenium
2.1%
1.2%
13%
16%
13%
23%
37%
3.3%
0.65%
8.2%
Vitamin Comparison
Vitamin comparison score is based on the number of vitamins by which one or the other food is richer. The "coverage" charts below show how much of the daily needs can be covered by 300 grams of the food.
6
100 g
300 g
1 slice (1 oz) - 28g 1 package, 2.5 oz - 71g
Vitamin C
Vit. C
Vitamin D
Vit. D
Vitamin A
Vit. A
Vitamin E
Vit. E
Vitamin B1
Vit. B1
Vitamin B2
Vit. B2
Vitamin B3
Vit. B3
Vitamin B5
Vit. B5
Vitamin B6
Vit. B6
Vitamin B12
Vit. B12
Vitamin K
Vit. K
Folate
Folate
1%
1.5%
0.67%
2.4%
13%
37%
80%
16%
51%
234%
1.8%
4.5%
4
100 g
300 g
1 oz - 28.35g 4 oz - 113g
Vitamin C
Vit. C
Vitamin D
Vit. D
Vitamin A
Vit. A
Vitamin E
Vit. E
Vitamin B1
Vit. B1
Vitamin B2
Vit. B2
Vitamin B3
Vit. B3
Vitamin B5
Vit. B5
Vitamin B6
Vit. B6
Vitamin B12
Vit. B12
Vitamin K
Vit. K
Folate
Folate
0%
0%
1%
5.8%
97%
54%
85%
15%
21%
103%
0%
0.75%
All nutrients comparison - raw data values
Nutrient
DV% diff.
Saturated fat
2.681g
25.26g
103%
Fats
5.82g
69.61g
98%
Monounsaturated fat
2.118g
32.89g
77%
Polyunsaturated fat
0.145g
8.11g
53%
Sodium
1078mg
25mg
46%
Vitamin B12
1.87µg
0.82µg
44%
Zinc
4.98mg
0.84mg
38%
Protein
21.8g
6.38g
31%
Selenium
17.7µg
1.5µg
29%
Vitamin B1
0.052mg
0.386mg
28%
Calories
147kcal
655kcal
25%
Iron
2.22mg
0.42mg
23%
Choline
81.6mg
15%
Phosphorus
175mg
86mg
13%
Vitamin B6
0.221mg
0.09mg
10%
Cholesterol
68mg
90mg
7%
Copper
0.091mg
0.04mg
6%
Vitamin B2
0.161mg
0.236mg
6%
Magnesium
17mg
3mg
3%
Potassium
210mg
148mg
2%
Vitamin B3
4.26mg
4.535mg
2%
Vitamin D*
4 IU
1%
Vitamin D
0.1µg
1%
Calcium
10mg
4mg
1%
Vitamin E
0.12mg
0.29mg
1%
Manganese
0.027mg
0.005mg
1%
Vitamin K
0.7µg
1%
Folate
6µg
1µg
1%
Protein per 100 calories
15g
0.97g
N/A
Calories per 10 g protein
67kcal
1027kcal
N/A
Weight per 100 calories
68g
15g
N/A
Unsaturated / Saturated Fat ratio
0.84
1.6
N/A
Vitamin C
0.3mg
0mg
0%
Net carbs
0.36g
0g
N/A
Carbs
0.36g
0g
0%
Sugar
0.1g
0g
N/A
Vitamin A
2µg
3µg
0%
Vitamin B5
0.265mg
0.25mg
0%
Tryptophan
0.141mg
0.021mg
0%
Threonine
0.857mg
0.21mg
0%
Isoleucine
0.976mg
0.168mg
0%
Leucine
1.706mg
0.446mg
0%
Lysine
1.812mg
0.528mg
0%
Methionine
0.558mg
0.095mg
0%
Phenylalanine
0.847mg
0.239mg
0%
Valine
1.065mg
0.305mg
0%
Histidine
0.684mg
0.072mg
0%
Fructose
0.01g
0%
Macronutrient Comparison
Macronutrient breakdown side-by-side comparison
4
22%
6%
70%
2%
Protein:
21.8 g
Fats:
5.82 g
Carbs:
0.36 g
Water:
69.53 g
Other:
2.49 g
1
6%
70%
22%
2%
Protein:
6.38 g
Fats:
69.61 g
Carbs:
0 g
Water:
22.19 g
Other:
1.82 g
Contains
more
Protein Protein
+241.7%
Contains
more
Carbs Carbs
+∞%
Contains
more
Water Water
+213.3%
Contains
more
Other Other
+36.8%
Contains
more
Fats Fats
+1096%
Fat Type Comparison
Fat type breakdown side-by-side comparison
1
54%
43%
3%
Saturated fat:
Sat. Fat
2.681 g
Monounsaturated fat:
Mono. Fat
2.118 g
Polyunsaturated fat:
Poly. Fat
0.145 g
2
38%
50%
12%
Saturated fat:
Sat. Fat
25.26 g
Monounsaturated fat:
Mono. Fat
32.89 g
Polyunsaturated fat:
Poly. Fat
8.11 g
Contains
less
Sat. Fat Saturated fat
-89.4%
Contains
more
Mono. Fat Monounsaturated fat
+1452.9%
Contains
more
Poly. Fat Polyunsaturated fat
+5493.1%